QA Supervisor (08.00x)
Software
General Data Protection Regulation (GDPR)
This product offers the possibility to process personal identifiable information such as system user name, role and IP-address. The purpose of this processing capability could be to enhance quality control through traceability and proper access management.
If you decide to process personal data you need to be aware of and comply with relevant personal data protection rules, including, in the EU the GDPR as well as other applicable laws, directives and regulations. Atlas Copco can in no way be held liable for any use made by you of the product.
Introduction
Target group
This user guide is intended for personnel using QA Supervisor for example:
Operator
Product function
Error reporting
Troubleshooting
Production technician
General function
Communication
System input/output
Quality engineer
Results / statistics
Data backup
IT/System maintenance
System capability
System monitoring
Data input style.
The objects in this documentation marked with " " or < > are variable values or data text field. The objects are highlighted and used together with the System data style. Insert the value between the characters " " and replace the < xxxxxx > as shown in the example.
Example:
<add name="SQL_Server"....User ID=User; Password=<Password>==;<add name="Tools_Server"....User ID=User; Password=UserPassword==;
Conventions
To enhance user understanding, certain formatting conventions are used throughout this document. The formatting conventions used are listed below.
Element | Notation | Description | Output |
|---|---|---|---|
General emphasis | In the Program workspace. | To make certain text elements stand out, or to highlight. | Text in Bold |
Graphical User Interface (GUI) items | Select the Function button. | Any reference to items found on screen in the GUI (for example, command buttons, icon names and field names). | Text in Bold |
Graphical User Interface (GUI) Path > | Generally, on the top of the GUI. | Navigation aid which keeps track of the location in the GUI. | For example: Controller > Program > Edit |
User input | Enter a Description for the program. | Any text input by the user. | Text in Bold |
File names | Enter a File Name for the export. | Files either exported from, or imported into the system. | Text in Bold Italic |
Variable and parameter names | Enter a Name for the export. | Variable and parameter names (not values). | Text in Italic |
Variable and parameter values | Enter a VALUE for the export. | Variable and parameter values. | Text in BOLD CAPS |
System output | Client.Domain.Models.ExportImportConfiguration | Any text output by the system. | Text in Monospace |
External links | Links to external sites that have information connected to the document or subject content. These could include:
| Selectable text to external sites | |
Internal documentation links |
If available, these links will be presented below the text. | Selectable text to internal content |
About the manual
The configuration manual is divided into the following sections:
Introduction: it explains the structure of the manual and the conventions used to explain the configuration.
Getting Started: it explains how to start the system and the main functions the operator can perform.
Features: the main bulk of the manual describes the various settings and configurations that can be performed by the operator.
The settings are divided into three categories:
Concept: it provides information about the settings or parameters.
Task: it provides instructions how to do the configuration.
Reference: it provides tables and listings of the parameter names descriptions and default values.
References: it gives the sources of the information related to the method of the inspections.
Third party licenses: if third party intellectual property is used in the product, it is described in this section.
The Features chapter follows the user interface structure. The various icons are explained and instruction procedures explain how configurations are created and edited.
Revision history
Software version | Change |
|---|---|
08.00x |
|
07.05x |
|
07.04x |
|
07.03x |
|
07.02x | - |
07.01x |
|
07.00x |
|
06.03x |
|
06.02x |
|
06.01x |
|
06.00x |
|
04.05x |
|
04.04x |
|
04.03x |
|
04.02x |
|
04.01x |
|
04.00x |
|
03.01x |
|
03.00x |
|
02.00x |
|
01.03x |
|
01.02x |
|
01.01x |
|
Getting started
Prerequisites
Many events in the operating environment may affect the tightening process and shall require a validation of results. In compliance with applicable standards and/or regulations, we hereby require to check the installed torque after any event that can influence the tightening result. Examples of such events include but are not limited to:
initial installation of the tooling system
change of part batch, bolt, screw batch, tool, software, configuration or environment
change of air- or electrical connections
change in line ergonomics, process, quality procedures or practices
changing of operator
any other change that influences the result of the tightening process
The check should:
ensure that the joint conditions have not changed due to events of influence
be done after initial installation, maintenance or repair of the equipment
occur at least once per shift or at another suitable frequency
Anyone interested in learning more can benefit from reading this manual and other QA Supervisor documentation.
Before starting the application ensure that:
the QA Supervisor server application is installed
controllers are configured to communicate with the QA Supervisor server application
Browser requirements
Google Chrome 112
Microsoft Edge 112 (chromium)
Mozilla Firefox 112
The browser zoom must always be set to 100% while using the application.
TLS versions prior to 1.2 are no longer supported.
Default ports
Port number | Function | Direction |
|---|---|---|
1883 | MQTT | Out |
4711 | QA Station MT/Open Protocol | In |
7102 | NotificationService | Out |
7110 | ACDC | Out |
8080 | QA Supervisor http port | In |
8443 | QA Supervisor https port | In |
9990 | QA Supervisor http management port | In |
9993 | QA Supervisor https management port | In |
60005 | STpad/STpalm/STbench | Out |
60101 | JSB (QA Supervisor Agent) | Out |
60102 | STa6000 (QA Supervisor Agent) | Out |
Starting the QA Supervisor
In a web browser, enter the URL http://<IP address or hostname>:8080/qasupervisor or https://<IP address or hostname>:8443/qasupervisor.

<IP Address> is the IP Address of the QA Supervisor Application Server.
<hostname> is the hostname of the QA Supervisor Application Server.
To make a safe connection, it is necessary to install a certificate. Contact the Atlas Copco Service Personnel for the installation of the certificate.
In the Username box and in the Password box, type the user name and the password, respectively.
Then, click Login.
After five failed logins, the user is disabled. To enable the user again, login the application as admin and edit the user configuration by changing the Status.
After five failed logins as Admin, the Admin user is disabled. To enable the user again, contact the Atlas Copco Service Personnel.
Features
Settings
After a successful start of QA Supervisor, the following is displayed:
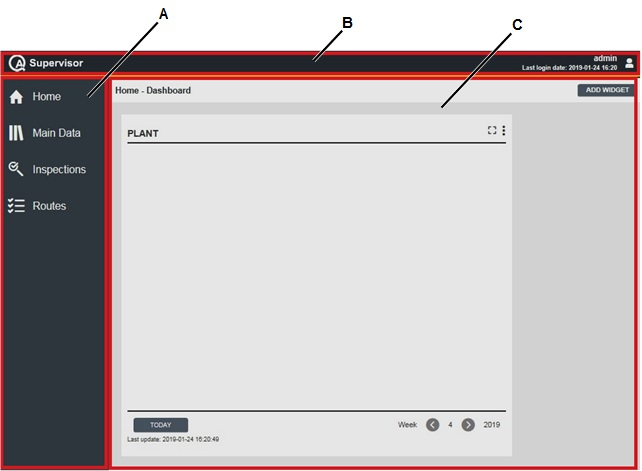
A | Left-side menu bar | B | QA Supervisor menu bar |
C | QA Supervisor workspace | ||
QA Supervisor workspace area displays different content and depends on the selected menu.
Navigate the left-side menu bar to view or edit any configuration parameters (for more information, see Main Data, Inspections, and Routes).
QA Supervisor menu bar is always on the top of the software page.
On the right side, the user name with the related user picture and the last login date are displayed.
Click the user name/user picture to open the following:
Application settings
Application custom fields
Personal settings
Notifications
Change password
Logout
Viewing/editing application settings
Each page of QA Supervisor software complies with the Application settings parameters selected in the Application settings page for all the users configured in the application.
On the right side of the QA Supervisor menu bar, click the user name/user picture. Then, click Application Settings.
Configure the available parameters.
Click on Save.
Application settings parameters
Application version: current version of the application.
General parameters
Background picture: click on the Add icon (
 ) to upload a new picture, or click on the Delete icon (
 ) to restore the default Atlas Copco background picture.
Date format: from the drop-down list, select the date format to use in the application.
Language: from the drop-down list select the language of the application.
Report format: from the drop-down list, select between DOCX and PDF.
Report logo: click on the Add icon (
) to upload a new picture and customize the logo displayed in the reports, or click on the Delete icon () to restore the default Atlas Copco logo.Online interval check: from the drop-down list, select between 30 s or 60 s.
Torque measurement unit: from the drop-down list, select the measurement unit to use in the application.
Status for replaced tool: from the drop-down list, select the default status for the tool to replace in a tool swap operation.
OP devices: retrieve old results: by default enabled; when an Open Protocol measuring device is connected for the first time, all the results stored in the device are transferred to QA Supervisor.
Once the measuring device is connected, this setting cannot be changed for the single device: if the switch is enabled, the old results are always retrieved; if the switch is disabled, the old results can no longer be retrieved.
If this option is disabled, at least one measurement must be stored in the device before connecting it to QA Supervisor.
If the new measuring device is created manually, it is possible to override this setting during the configuration of the Measuring Device parameters.
Deleted measurements
In the Deleted measurements section, select the Deleted measurements options to display the deleted results of the tests made by STbench/ STpad/STpalm.
Click on the switches to enable/disable the following options:
Display in pages and export: by enabling this option, it is possible to display the deleted results in the Data details card and in the exported excel files.
Display in reports: by enabling this option, it is possible to display the deleted measurements in the tests reports.
Not detected measurements
In the Not detected measurements section, select the Not detected measurements options to display the measurements not detected by STbench/STpad/STpalm.
Click on the switches to enable/disable the following options:
Display in pages and export: by enabling this option, it is possible to display the not detected measurements in the Data details card and in the exported excel files.
Display in reports: by enabling this option, it is possible to display the not detected measurements in the tests reports.
Traces
Display traces in application: by enabling this option, the Traces menu and the traces linked to the joints are displayed in the application.
Custom URLS
In the Custom URLS section, it is possible to add up to four URLS that will be available for navigation on STbench/ STpad/STpalm.
For each URL, type the name of the label. The labels will be displayed on STbench/ STpad/STpalm.
The web browser navigation bar will not be present on the devices: navigation is limited to the configured URLs and some basic browser functionality are inhibited (such as: next, back, refresh, right-click, etc.).
Due to screen size, QA Supervisor is not available for navigation on STpalm.
Additional status (for not in use tools)
In the Additional status (for not in use tools) section, define the condition of the tools that are not in use.
Assign a customized name to each status by typing the name in the Status text box.
Then, enable/disable one or more statuses by clicking on the status switch.
Status text boxes must always have a name.
The maximum number of characters for the Status name is 50.
It is not allowed to configure two statuses with the same name.
API communication
API are a set of commands that allow to integrate QA Supervisor with other systems.
In the API communication section, click on the switch to enable/disable API communication.
By default, the API enable switch is disabled.
Default values
In the Common section of the Default values, configure the parameters common to all inspections.
In the Default values section, configure the default values for Tool check, Joint check, Visual check, and Dimension inspections.
For the SPC inspections of each type, it is possible to enable a custom set of rules to be used by STpad.
In the Default value, click the value of the Enabled rules.
In the SPC Enabled rules page, enable or disable the rules to use and click Apply.
ToolsNet 8 Settings
Connectivity
In the Connectivity section, type the IP address/hostname and port of the following ToolsNet 8 services:
Data communication service: the default port is 7110.
Notification service: the default port is 7102
MQTT server: the port is optional; the connection must be open without credentials.
Click on the Check button placed next to each service to check the connection between QA Supervisor and ToolsNet 8 services. A popup message with the status of the connection is shown, and the following details are displayed in the ToolsNet 8 Parameters section: application name; application version; API version.
If an older version of ToolsNet 8 is used, additional information on QA Supervisor features not supported by the ToolsNet 8 version in use are displayed.
Refer to the ToolsNet 8 manuals for more information about these services.
Automatic Tool Import
In the automatic tool import sections, it is possible to set up the parameters used for the tool synchronization.
Enable automatic tool import: by enabling this option, the tool synchronization will be activated.
Do not enable automatic tool import unless the parameters below have been checked. Imported tools can’t be deleted.
The below fields are disabled if the enable automatic tool import is not enabled.
Tools used in the last ... months: only tools that have performed a tightening in the specified time frame are synchronized from ToolsNet.
Default location: select the location where the imported tools are placed.
Default status: select the status that is assigned to the imported tools.
Default manufacturer: select the manufacturer that is set for the imported tool model.
During the tool synchronization several scenarios could occur:
Scenario 1: the part code is sent from ToolsNet 8 and a tool model with the same part code is already defined. In this case, the new tool is created with the already defined tool model.
Scenario 2: the part code is sent from ToolsNet 8 but a tool model with the same part code is not defined. In this case, the new tool is created with a brand new tool model with a generic type
Scenario 3: the part code is not sent from ToolsNet 8. In this case, the tool is created without a model.
For scenarios 2 and 3, a manual user action is needed complete the data. It is not possible to create inspections on tools that don’t have a tool model or tools with a generic tool model.
Viewing/editing the application custom fields
In order to enable the custom fields on STbench/STpad/STpalm it is mandatory to configure and save the Application custom fields.
On the right side of the QA Supervisor menu bar, click the user name/user picture. Then, click on Application Custom fields.
In the Route custom fields section, add/select/remove the custom fields that will be used as filters for the routes on STpad/STpalm/STbench.
Click on Save.
The custom fields configured in the Application custom fields are automatically added in each new route created.
Application custom fields parameters
Custom field 1-5: add/select/remove the custom field.
Do one of the following:
Click Add icon (
) to add a new custom field. In the Add Selectable card, configure the available parameters related to the new custom field.
Then, click Save.
Click Search icon (
 ) to select a custom field already configured.
In the Selectables card, select a custom field from the list.
Then, click Apply.
Click Delete icon (
) to remove the custom field.
For more information on how to create Selectables, refer to the paragraph Selectables.
Reports settings
The customizable analysis reports are: CmCmk/CpCpk trend, Capability, Gage R&R.
The customizable inspection results reports are: CmCmk, SPC (tool), Tool calibration.
To customize the template of a report:
On the right side of the QA Supervisor menu bar, click the user name/user picture. Then, click Reports settings.
On the left side of the Reports settings workspace, click on the report of interest to open the configuration card.
Download the Standard template and make adjustments as needed.
In the Custom template section, click on the Select button to upload the edited template.
Once uploaded, the switch placed next to the report selected changes from Standard to Custom.On the upper-right corner of the Reports settings page, click Save.
To restore the standard template of a report:
On the right side of the QA Supervisor menu bar, click the user name/user picture. Then, click Reports settings.
On the left side of the Reports settings workspace, click on the report of interest to open the configuration card.
In the Custom template section, click on the Delete button to remove the custom template.
Once deleted, the switch placed next to the report selected changes from Custom to Standard.On the upper-right corner of the Reports settings page, click Save.
Viewing/editing personal settings
On the right side of the QA Supervisor menu bar, click the user name/user picture. Then, click Personal settings.
On the left side of the Personal settings page, enter the Personal details.
On the left side of the Personal settings page, below the Personal details, enter the Company contacts information.
On the right side of the Personal settings page, select the Preferences.
On the right side of the Personal settings page, below the Preferences, select the Measurement unit.
Each page of QA Supervisor software agrees with the Preferences and the Measurement unit selected in the Personal settings page.
On the upper-right corner of the Personal settings page, click Save.
Viewing/editing notifications
On the right side of the QA Supervisor menu bar, click on the user name/user picture. Then, click Notifications.
On the left side of the Notifications workspace, click on the switches to enable/disable the following event notifications:
Inspection NOK: if enabled, a notification is sent when an inspection result is NOK.
Inspection expired: if enabled, a notification is sent when an inspection is expired.
Inspection expiring: if enabled, a notification is sent before an inspection expires.
Certificate expired: if enabled, a notification is sent when the certificate of a transducer or measuring device is expired.
Tightening program changed: if enabled, a notification is sent when a Tightening program that belongs to an inspection is changed.
Tool import (from ToolsNet 8): if enabled, a notification is sent when a Tool is imported from ToolsNet 8.
Tool model import (from ToolsNet 8): if enabled, a notification is sent when a Tool Model is imported from ToolsNet 8.
Tool Swap: if enabled, a notification is sent when a Tool Swap operation is performed.
On the left side of the Notifications workspace, click on each notification to open the configuration card.
For each notification, configure the available parameters.
Notifications parameters
Location (*): select the area of the plant where to send the event notification. By default it is set to the is the location of the user.
To change the default location:
Click Location icon (
 ).
).In the Location dialog box, select the area of the plant.
Then, click Apply.
Inspection Type
Tool check: click on switch to enable/disable the notification event for Tool check inspections.
Joint check: click on switch to enable/disable the notification event for Joint check inspections.
Visual check: click on switch to enable/disable the notification event for Visual check inspections.
Dimension: click on switch to enable/disable the notification event for Dimensional inspections.
By part grouping: click on switch to enable/disable the notification event for By part grouping inspections.
Expiring filters
The following parameters are displayed only for the Inspection expiring notification.
If the Inspection expiring notification is enabled, at least one of the following Expiring filters must be set. The Expiring filters can be combined together.
Expiry period %: by setting a percentage value from 50 to 99, a notification is sent when the inspection expiry period reaches the defined percentage value.
Remaining days: by setting a number of days from 1 to 364, a notification is sent when the defined remaining days before expiration are reached.
Remaining hours: by setting a number of hours from 1 to 72, a notification is sent when the defined remaining hours before expiration are reached.
Expiry date: from the drop-down list, select between:
Today: by selecting this value, a notification is sent the day of the inspection expiration date.
Tomorrow: by selecting this value, a notification is sent the day before the inspection expiration date.
This month: by selecting this value, a notification is sent for the inspections expiring in the current month.
Next month: by selecting this value, a notification is sent for the inspections expiring during the next month.
Notification channels
Online: click on the switch to enable/disable the notifications online.
To receive notifications of the events, the Online switch must be enabled.
Email: click on the switch to enable/disable the notifications by emails.
To enable the reception of notifications by email, contact Atlas Copco Service Personnel.
The notification emails are sent to the email address set in the Personal settings. To set or change the email address, refer to the paragraph Viewing/editing personal settings.
Changing the password
On the right side of the QA Supervisor menu bar, click the user name/user picture. Then, click Change password.
In the Password box, type the old password.
In the New password box, type the new password.
In the Confirm new password box, type the new password again.
On the lower-right corner of the Change password dialog box, click Save.
In the upper-right corner of the Change password dialog box, click Close button to exit the Change password dialog box without saving any change.
Follow these requirements for the New password:
The New password must be 8 to 25 characters long.
The New password must have one upper case character (at least).
The New password must have one lower case character (at least).
The New password must have one number (at least).
Empty spaces are permitted.
Upper/lower case characters with accent are not upper/lower case characters.
CODE 39 character set is permitted.
Home page
On the left-side menu bar, click Home.
The Home page displays a widget that lists all the scheduled inspections to be done during each day of the selected week. Within the selected week, the inspections are ordered according to date and time.
If the Dashboard license is activated, it is possible to configure other types of widgets and to create multiple dashboards:
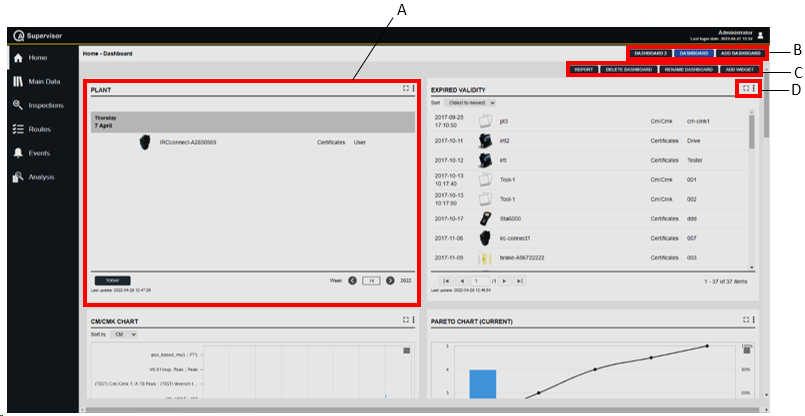
A | Example of a widget | B | Navigate dashboards / Add dashboard |
C | Dashboard command buttons | D | Widget icons |
In the Home - Dashboard workspace, configure the following widgets:
Calendar: widget that shows the due date of Measuring device and Transducer calibration certificates and scheduled inspections.
Cm/Cmk: widget that shows the worst values of Cm and Cmk for each pair tool – executed inspection.
Pareto: widget that shows the Pareto chart of the NOK results related to a tool.
Expirations: widget that lists all the expired Measuring device and Transducer calibration certificates and scheduled inspections.
Cp/Cpk: widget that shows the worst values of Cp and Cpk for each pair joint – executed inspection.
Sent routes: widget that shows the status and the scheduling of each Route sent to the measuring devices.
If the Dashboard license is not active, only the Calendar widget is displayed in the dashboard.
Calendar widget
The Calendar widget shows for each day the scheduled inspections to be done and the expired calibration certificates of measuring devices and transducers.
On the upper-right corner of the Calendar widget, the following icons are shown:
Full screen: click to enlarge and show only the widget.
Menu: click to change the configuration of the widget (for more information, see “Adding Calendar widget(s)”).
On the lower-left corner of the calendar page, click Today: the current week is displayed and the current day is yellow highlighted in case of scheduled inspection(s).
On the lower-right corner of the calendar page, click the arrow keys to browse all of the scheduled inspections, week by week.
Cm/Cmk widget
The Cm/Cmk widget shows the worst values of the Cm and related Cmk for each pairs of executed inspection – tool ordered by increasing Cm or Cmk values.
On the upper-right corner of the Cm/Cmk widget, the following icons are shown:
Full screen: click to enlarge and show only the widget.
Menu: click to change the configuration of the widget (for more information, see “Adding a Cm/Cmk widget”).
Above the Cm/Cmk graph, the Sort by filter is displayed. Select one of the available options to give an order to the data depending on Cm or Cmk.
On the upper-right corner of the graph, a menu to print and download the chart as image is displayed. Select one of the options.
Pareto widget
The Pareto widget shows the histogram of the NOK results of an ispection of type: Tool check, Joint check, Visual check, and Dimensional check.
On the upper-right corner of the Pareto widget, the following icons are shown:
Full screen: click to enlarge and show only the widget.
Menu: click to change the configuration the widget (for more information, see “Adding a Pareto widget”).
On the upper-right corner of the graph, a menu to print and download the chart as image is displayed. Select one of the options.
Expirations widget
The Expirations widget shows for each day the expired inspections and calibration certificates of measuring devices and transducers.
On the upper-right corner of the Expirations widget, the following icons are shown:
Full screen: click to enlarge and show only the widget.
Menu: click to change the configuration of the widget (for more information, see “Adding Expirations widget”).
Cp/Cpk widget
The Cp/Cpk widget shows the worst values of the Cp and related Cpk for each pairs of executed inspection – tool ordered by increasing Cp or Cpk values.
On the upper-right corner of the Cp/Cpk widget, the following icons are shown:
Full screen: click to enlarge and show only the widget.
Menu: click to change the configuration of the widget (for more information, see “Adding a Cp/Cpk widget”).
Above the Cp/Cpk graph, the ”Sort by” filter is displayed. Select one of the available options to give an order to the data depending on Cp or Cpk.
On the upper-right corner of the graph, a menu to print and download the chart as image is displayed. Select one of the options.
Sent routes widget
The Sent routes widget shows the status and the scheduling of each route sent to the measuring devices.
On the upper-right corner of the Sent routes widget, the following icons are shown:
Full screen: click to enlarge and show only the widget.
Menu: click to change the configuration of the widget (for more information, see “Adding Calendar widget(s)”).
Adding a widget
On the upper-right corner of the Dashboard workspace, click Add widget.
In the Add widget dialog box, select le widget type to add.
On the lower-right corner of the Add widget dialog box, click OK.
On the upper-right corner of the Widget, click Menu icon to select one of the following options:
Resize: select Resize to decrease the widget size to half.
Move down: select Move down to move the widget to the next position, if more than one widget is configured.
Move up: select Move up to move the widget to the previous position, if more than one widget is configured.
Configure: set the options to filter the widget data.
Delete: select Delete to delete the widget.
On the lower-right corner of the Widget, click OK.
Calendar widget configuration
Location: select an element of the factory structure tree.
Title: type the name of the widget in the Title text box or type the mark up listed below the title text box.
Due date: select one of the following due date: Inspection expiring or Calibration certificate expiring.
Type: select inspection type. The available types are: Tool check or Joint check. The Type filter is available only if Inspection expiring is selected as due date.
Method: select the inspection method. It depends on the selected inspection type. The Method filter is available only if Inspection expiring is selected as due date.
Refresh: select the time to refresh automatically the widget. The available value are: None, Every minute, Every 5 minutes, Every 15 minutes.
Cm/Cmk widget configuration
Location: select an element of the factory structure tree.
Title: type the name of the widget in the Title text box or type the mark up listed below the title text box.
Controlled variable: select the variable to control. The available options are: Angle and Torque.
Number of object: select the number of value to display. The available values are: 5, 10, 20, and 50.
Refresh: select the time to refresh automatically the widget. The available value are: None, Every minute, Every 5 minutes, Every 15 minutes.
Pareto widget configuration
Location: select an element of the factory structure tree.
Date range: filter the date range. Do one of the following:
From - to: click the box to open a calendar. Select the date from the calendar. Then, click Delete icon (
) to delete a date already configured.Range: in the Range drop-down list, select a specific time interval.
Title: type the name of the widget in the Title text box or type the mark up listed below the title text box.
Type: select inspection type. The available types are: Tool check, Joint check, Visual check or Dimensional check.
Method: select the inspection method. It depends on the selected inspection type.
Refresh: select the time to refresh automatically the widget. The available value are: None, Every minute, Every 5 minutes, Every 15 minutes.
Expirations widget configuration
Location: select an element of the factory structure tree.
Title: type the name of the widget in the Title text box or type the mark up listed below the title text box.
Due date: select one of the following due date: Inspection expiring or Calibration certificate expiring.
Type: select inspection type. The available types are: Tool check or Joint check. The Type filter is available only if Inspection expiring is selected as due date.
Method: select the inspection method. It depends on the selected inspection type. The Method filter is available only if Inspection expiring is selected as due date.
Refresh: select the time to refresh automatically the widget. The available value are: None, Every minute, Every 5 minutes, Every 15 minutes.
Cp/Cpk widget configuration
Location: select an element of the factory structure tree.
Title: type the name of the widget in the Title text box or type the mark up listed below the text box.
Controlled variable: select the variable to control. The available options are: torque (default value), area, force, pressure, length, volume.
Number of object to show: select the number of value to display. The available values are: 5, 10, 20.
Refresh: select the time to refresh automatically the widget. The available value are: None, Every minute, Every 5 minutes, Every 15 minutes.
Sent routes widget configuration
Title: type the name of the widget in the Title text box.
Status: select one or more statuses. The available statuses are: Pending, Sent, Got results, Not sent.
Route name: type the name of the route(s) to display.
Refresh: select the time to refresh automatically the widget. The available values are: None, Every minute, Every 5 minutes, Every 15 minutes.
Adding a Dashboard
If the Dashboard license is active, it is possible to create up to 10 different dashboards.
On the upper-right corner of the Home - Dashboard workspace, click Add dashboard.
On the upper-right corner of the Home - Dashboard workspace, using the command buttons it is possible to:
Report: create a report to export the information of the widget(s) contained in the selected dashboard. The widgets exported are: Pareto widget, Cm/Cmk widget, Cp/Cpk widget.
Delete dashboard: delete the selected dashboard.
Rename dashboard: rename the selected dashboard.
Add widget: add one or more widget types.
Main Data menu
On the left-side menu bar, click Main Data to configure the following items:
Measuring devices
Transducers
Joints
Tools
Controller units
Measuring devices models
Transducer models
Tools models
Controller models
Manufacturers
Suppliers
Binary options
Attribute lists
Selectable
Users
Roles
Factory structure
Measuring devices
On the left-side menu bar, click Main Data > Measuring devices.
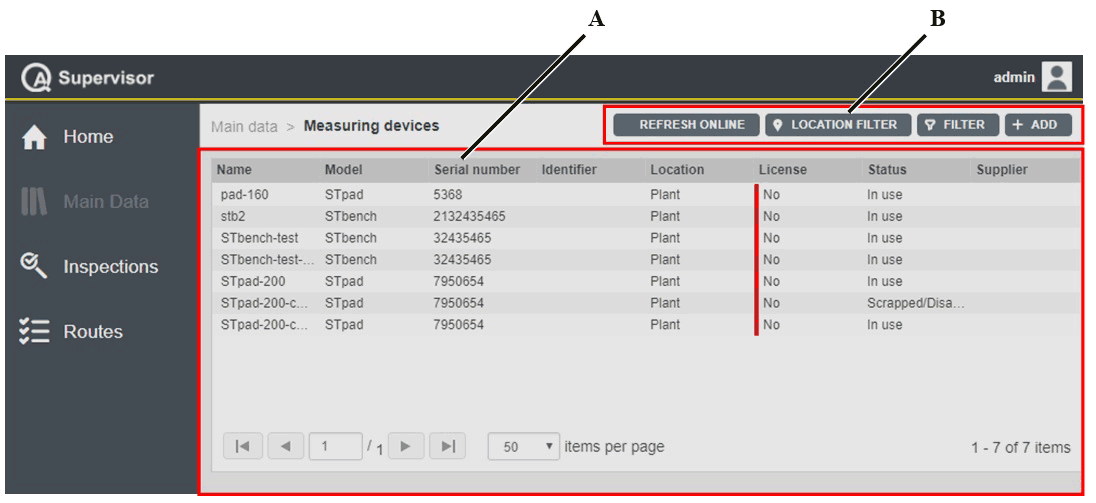
A | Measuring devices workspace | B | Command buttons |
The Measuring devices workspace is divided into the following columns:
Name: name of the measuring device.
Model: model of the measuring device.
Serial number: serial number of the measuring device.
Identifier: custom identification code linked to the current measuring device.
Location: area of the plant where using the measuring device.
License: below are the license options, depending on the status of the license of the measuring device:
Yes: measuring device with license.
No: measuring device without license.
N/A: measuring devices without network connectivity (MRTT-C, IRC-Connect, and STwrench).
Status: below are the available options, depending on the status of the measuring device:
In use: the measuring device is ready to work on the production applications.
Service/Repair: the measuring device cannot be used on the assembly line before maintenance is complete. The capability of the measuring device is verified according to customer’s procedures.
Scrapped/Disabled: the measuring device is out of order. Do not use it on the assembly line.
Supplier: supplier of the measuring device.
In the Measuring devices workspace, click a measuring device to display the related Measuring Device Details card.
On the upper-right corner of the Measuring Device Details card, click the Close button to exit the Measuring Device Details card.
At the end of the Measuring Device Details card, the following items record all of the changes made for the selected measuring device:
Version: version of the measuring device configuration.
In the Edit Measuring Device dialog box, change one of the following items to make a new version: Serial number, Identifier, Location, and Status.
Changed by: name of the operator who has made a change to the measuring device configuration.
History: the history table records all of the changes made for the selected measuring device.
The first line of the history table summarizes the latest version of the measuring device configuration. Click a previous line: the related Measuring Device Details card opens on the left of the Measuring Device Details card related to the latest version. The differences between the two Measuring Device Details cards are yellow highlighted.
On the upper-right corner of the oldest Measuring Device Details card, click Restore: the previous version of the measuring device configuration becomes the latest one.
On the upper-right corner of the Measuring devices workspace, there are the following command buttons:
Add: click to add a new measuring device into the Measuring devices page.
Filter: click to give filters and list only the necessary measuring device(s).
Location Filter: click to filter the measuring device(s) depending on its location in the factory structure.
Refresh Online: click to refresh the Measuring devices page and to verify if the enlisted measuring device(s) with In use status are online or not.
Adding a measuring device
On the left-side menu bar, click Main Data > Measuring devices.
On the upper-right corner of the Measuring devices workspace, click Add.
In the Add Measuring Device dialog box, configure the measuring device parameters.
On the upper-right corner of the Add Measuring Device dialog box, click Save.
Editing a Measuring Device Details card
On the upper-right corner of the Measuring Device Details card, click Edit.
In the Edit Measuring Device dialog box, make the necessary changes.
On the upper-right corner of the Edit Measuring Device dialog box, click Save.
Measuring device parameters
Name (*): type the name of the measuring device.
Description: type a description of the measuring device.
Model (*): select a model. The available measuring devices models are:
IRC-Connect
JSB
MRTT-C
QA Station MT
Open Protocol
STa 6000
STbench
STpad
STpad Cable Adapter
STpalm
STwrench
STRwrench
The QA Station MT/Open Protocol can be created automatically by entering the QA Supervisor hostname and port (port number 4711) in the measuring device.
The Add Measuring Device dialog box changes depending on the model selected.
Serial number (*): type the serial number of the measuring device.
Identifier: type the identification code linked to the measuring device.
Location (*): select the area of the plant where using the new measuring device model. By default it is set to the is the location of the user.
Do as follows:
Click Location icon (
).
In the Location dialog box, select the area of the plant where using the new measuring device model.
Then, click Apply.Status (*): select one of the following options, depending on the status of the measuring device:
In use: the measuring device is ready to work on the production applications.
Service/Repair: the measuring device cannot be used on the assembly line before maintenance is complete. The capability of the measuring device is verified according to customer’s procedures.
Scrapped/Disabled: the measuring device is out of order. Do not use it on the assembly line.
By default, the status is set to In use
Barcode configuration (*): select one of the following options:
Online & offline: it enables the search of inspections both locally and on QA Supervisor when a barcode is scanned on the measuring device.
Only online: it enables the search of inspections on QA Supervisor when a barcode is scanned on the measuring device.
Only offline: it enables the local search of inspections when a barcode is scanned on the measuring device.
None: it disables the search of inspections by scanning a barcode on the measuring device.
This field is available only for STpad, STpalm and STbench.
Automatic clean up: click on the switch to enable/disable the deletion of the data sent by QA Supervisor before a new route is sent to the measuring device.
By enabling this switch, the results of the inspections are not deleted.
This field is available only for STpad, STpalm and STbench.Enable delete measures: click on the switch to enable/disable the deletion of measures while running an inspection.
This field is available only for STpad, STpalm and STbench.Enable custom Web links: click on the switch to enable/disable the possibility to navigate the URLs configured in the Application Settings.
This field is available only for STpad, STpalm and STbench.Enable trace processing: click on the switch to enable/disable the possibility to view and process traces on the measuring device.
This field is available only for STpad and STbench.Retrieve old results: click on the switch to enable/disable the automatic acquisition of the results stored in the measuring device when connected to QA Supervisor.
This field is available only for QA Station MT/Open Protocol.If this option is disabled, at least one measurement must be stored in the device before connecting it to QA Supervisor.
License: the license switch is displayed depending on the model of the measuring device selected. The measuring devices without network connectivity (MRTT-C, IRC-Connect, and STwrench) do not show the license switch.Click the License switch to enable the license (the switch becomes blue colored).
The counter on the right of the License switch displays the available license(s) with the total number of enabled license(s) (for example, if the counter is x/y, x is the number of the available license(s) and y is the total number of the enabled license(s)).
The License switch is disabled and the counter is 0/0, if there are no available license(s).
The License switch (and the counter) is not displayed, in case of Unlimited License.
JSB license: the JSB license switch is displayed only if the model JSB is selected.
Click the License switch to enable the license (the switch becomes blue colored).
The counter on the right of the License switch displays the available license(s) with the total number of enabled license(s) (for example, if the counter is x/y, x is the number of the available license(s) and y is the total number of the enabled license(s)).
Connectivity
Host: type the host address of the measuring device.
Port: type the port number to communicate with the measuring device.
Supplier: click the arrow to open the supplier list and select the necessary supplier.
To add a new supplier, click Add icon ().
In the Add Supplier dialog box, enter the details related to new supplier.
Then, click Save.Purchase date: click the box and select the purchase date.
To delete a purchase date previously configured, click Delete icon ().Calibration certificates: in the Calibration certificates box, select the necessary calibration certificate.
To add a new calibration certificate, click Add icon ().
In the Add Calibration Certificate dialog box, enter the following details related to new calibration certificate:Calibration procedure (*): type the name of the Calibration procedure used to calibrate the measuring device.
Calibration system: calibration system of the current calibration certificate. It is the traceability information for the selected measuring device with a known accuracy, higher than the expected device under calibration and certificated according the same standard for which the calibration certification is claimed for the device under test.
Calibration system S/N: type the serial number of the system used to calibrate the measuring device.
Reference transducer: traceability information for the transducer device used to calibrate a measuring device under test, where the sensitivity and the precision is proved and certified so that its output can be used as reference values for the comparisons in the calibration procedure.
Reference transducer S/N: type the serial number of the reference transducer used.
Certificate number: type the number of the calibration certificate.
Certificate link (attachment): attachment box for any document related to the calibration certificate.
Certificate date: enter the date of the emission of the certificate.
Certification expiry date (*): enter the expiry date of the calibration certificate.
Laboratory: name of the laboratory where the calibration certificate was done.
Laboratory accreditation ID: type the accreditation identification number of the laboratory where the calibration certificate was done.
Accreditation body: type the name of the accreditation body. The Accreditation body is the independent body that assessed the laboratory for the conformity to the reference standard.
Then, click Save.
To edit a calibration certificate already configured, in the Calibration certificates box, select it.
Click Edit icon ( ).
).
In the Edit Calibration Certificate dialog box, edit the calibration certificate details.
Then, click Save.
To delete a calibration certificate already configured, in the Calibration certificates box, select it.
Then, click Delete icon ().Connected measuring devices: in the Connected measuring devices box, select the measuring device to be connected.
To add a new measuring device, click Add icon ().
In the Add Measuring Device dialog box, enter the details related to new measuring device.
Then, click Save.
To select a measuring device already configured, click Search icon ().
In the Measuring Devices workspace, select the necessary measuring device.
Then, click Apply.
To delete a measuring device already configured, in the Measuring devices box, select it.
Then, click Delete icon ().Connected transducers: in the Connected transducers box, select the transducer to be connected with the measuring device.
To add a new transducer, click Add icon ().
In the Add Transducer dialog box, enter the details related to new transducer.
Then, click Save.
To select a transducer already configured, click Search icon ().
In the Transducers workspace, select the necessary transducer.
Then, click Apply.
To delete a transducer already configured, in the Connected transducers box, select it.
Then, click Delete icon ().Notes: if necessary, type a note.
Items marked with an asterisk (*) are required.
Cloning a Measuring Device Details card
On the upper-right corner of the Measuring Device Details card, click Clone.
The Add Measuring Device dialog box automatically opens with all the items configured as in the Measuring Device Details card cloned.
If necessary, in the Add Measuring Device dialog box, make the necessary changes.
On the upper-right corner of the Add Measuring Device dialog box, click Save.
Getting results from the measuring device with QA Supervisor
If a measuring device has a license and it is online, on the upper-right corner of the Measuring Device Details card, click on Get results to retrieve results from the measuring device with QA Supervisor.
To get results from STa 6000, the device must be in the Home page of the application. Otherwise, an Information message is displayed on the device.
When online, results from STbench/STpad/STpalm are automatically synchronized with QA Supervisor each time an inspection is completed.
In case of "Forced by piece route", results are automatically synchronized with QA Supervisor when the operator exits the measurement screen on the device.
A green notification message is displayed when the synchronization is successfully complete.
After the results are got from the measuring devices, the Measuring devices details card is updated with the following items:
Last online date: date of the last time the measuring device has been online.
Firmware version: version of the firmware of the STpad or STbench.
Cleaning up a Measuring device
On the upper-right corner of the Measuring Device Details card, click Clean up.
The data sent by QA Supervisor to the measuring device are deleted from the device memory.
Setting the measuring device filter
On the left-side menu bar, click Main Data > Measuring devices.
On the upper-right corner of the Measuring devices workspace, click Filter.
In the Measuring Devices Filter dialog box, set the filter criteria (depending on the customer needs) (part 1):
On the upper-right corner of the Measuring Devices Filter dialog box, click Apply.
Measuring device filter criteria
Name: type the name of the measuring device to be filtered.
Serial number: type the serial number of the measuring device to be filtered.
Identifier: type the identification code linked to the measuring device to be filtered.
Status: select one of the following options, depending on the status of the measuring device to be filtered:
In use: select the measuring device ready to work on the production applications.
Service/Repair: the measuring device cannot be used on the assembly line before maintenance is complete. The capability of the measuring device is verified according to customer’s procedures.
Scrapped/Disabled: select the measuring device out of order. Do not use it on the assembly line.
License: select one of the following options:
Yes: select the measuring device(s) with license.
No: select the measuring device(s) without license.
Both: select both the measuring device(s) with license and the measuring device(s) without license.
If the measuring device does not have any license, a red line is displayed in the License column of the Measuring devices workspace, on the left of the license option of the measuring device.
Calibration certificate: select one of the following options:
At least one valid: select the measuring device(s) with at least one valid calibration certificate.
None valid: select the measuring device(s) without valid calibration certificate.
Online: select one of the following options:
Yes: select the measuring device(s) online.
No: select the measuring device(s) offline.
If the measuring device is online, a blue line is displayed in the Name column of the Measuring devices workspace, on the left of the name of the measuring device.
Models: in the Models box, select the measuring device model to be filtered.
To select a measuring device model, click Search icon (
).In the Tool Models workspace, select the necessary measuring device model.
Then, click Apply.
To delete a measuring device model, in the Models box, select it.
Then, click Delete icon (
).Connected Measuring devices: in the Connected measuring devices box, select the necessary measuring device.
To select a measuring device, click Search icon (
).In the Measuring Devices workspace, select the necessary measuring device.
Then, click Apply.
To delete a measuring device, in the Measuring devices box, select it.
Then, click Delete icon (
).Connected transducers: in the Connected transducers box, select the necessary transducer.
To select a transducer, click Search icon (
).In the Transducers workspace, select the necessary transducer.
Then, click Apply.
To delete a transducer, in the Connected transducers box, select it.
Then, click Delete icon (
).Selected filter: from the drop-down list, select one of the saved customized filter.
For more information on how to manage customized filters, refer to Filters customization.
Transducers
On the left-side menu bar, click Main Data > Transducers.
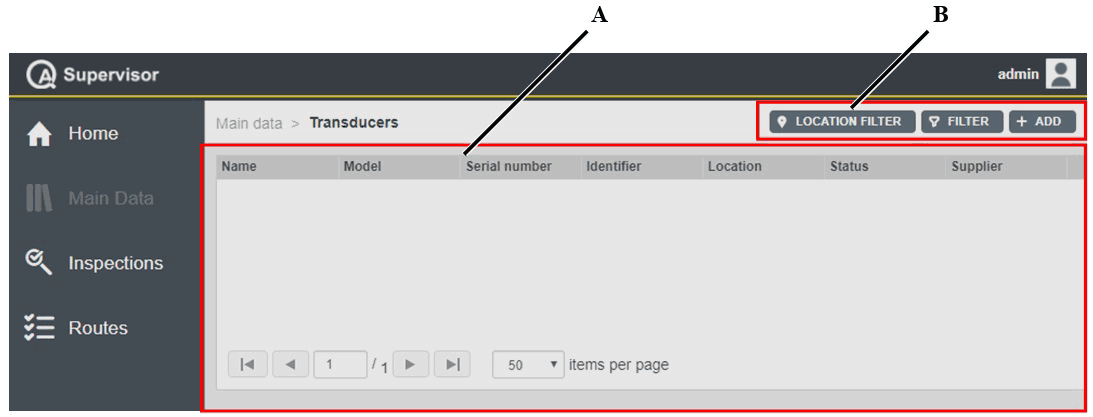
A | Transducers workspace | B | Command buttons |
The Transducers workspace is divided into the following columns:
Name: name of the transducer.
Model: model of the transducer.
Serial number: serial number of the transducer.
Identifier: custom identification code linked to the current transducer.
Location: area of the plant where using the transducer.
Status: below are the available options, depending on the status of the transducer:
In use: the transducer is ready to work on the production applications.
Service/Repair: the transducer cannot be used on the assembly line before maintenance is complete. The capability of the transducer is verified according to customer’s procedures.
Scrapped/Disabled: the transducer is out of order. Do not use it on the assembly line.
Supplier: supplier of the transducer.
In the Transducers workspace, click a transducer to display the related Transducer Details card.
On the upper-right corner of the Transducer Details card, click the Close button to exit the Transducer Details card (without saving any change).
At the end of the Transducer Details card, the following items record all of the changes made for the selected transducer:
Version: version of the transducer configuration.
In the Edit Transducer dialog box, change one of the following items to make a new version: Serial number, Identifier, Location, Location history, Status, Sensitivity, Min Load, and Full scale.
Changed by: name of the operator who has made a change to the transducer configuration.
History: the history table records all of the changes made for the selected transducer.
The first line of the history table summarizes the latest version of the transducer configuration. Click a previous line: the related Transducer Details card opens on the left of the Transducer Details card related to the latest version. The differences between the two Transducer Details cards are yellow highlighted.
On the upper-right corner of the oldest Transducer Details card, click Restore: the previous version of the transducer configuration becomes the latest one.
On the upper-right corner of the Transducers workspace, there are the following command buttons:
Add: click to add a new transducer into the Transducers workspace.
Filter: click to give filters and list only the necessary transducer(s).
Location Filter: click to filter the transducer(s) depending on its location in the factory structure.
Adding a transducer
On the left-side menu bar, click Main Data > Transducers.
On the upper-right corner of the Transducers workspace, click Add.
In the Add Transducer dialog box, configure the tranducer parameters.
On the upper-right corner of the Add Transducer dialog box, click Save.
Editing a Transducer Details card
On the upper-right corner of the Transducer Details card, click Edit.
In the Edit Transducer dialog box, make the necessary changes.
On the upper-right corner of the Edit Transducer dialog box, click Save.
Transducer parameters
Name (*): type the name of the transducer.
Description: type a description of the transducer.
Model (*): add/select the transducer model.
Do one of the following:
Click Add icon (
) to add a new transducer model. In the Add Transducer Model dialog box, enter the details related to new transducer.
Then, click Save.
Click Search icon (
) to select a transducer model already configured.In the Transducer Model workspace, select the necessary transducer model.
Then, click Apply.
Serial number (*): type the serial number of the transducer.
Identifier: type the identification code linked to the transducer.
Location (*): select the area of the plant where using the new transducer model. By default it is set to the is the location of the user.
Do as follows:
Click Location icon (
).In the Location dialog box, select the area of the plant where using the new transducer model.
Then, click Apply.
Status (*): select one of the following options, depending on the status of the transducer:
In use: the transducer is ready to work on the production applications.
Service/Repair: the transducer cannot be used on the assembly line before maintenance is complete. The capability of the transducer is verified according to customer’s procedures.
Scrapped/Disabled: the transducer is out of order. Do not use it on the assembly line.
By default, the status is set to In use.
Sensitivity: type the sensitivity of the transducer.
Measurement unit: select the measurement unit to define the torque parameters of the transducer. The default measurement unit is defined both in the Application settings and in the Personal settings.
Min load: type the minimum load of the transducer.
Full scale: type the full scale of the transducer.
Supplier: click the arrow to open the supplier list and select the necessary supplier.
To add a new supplier, click Add icon (
).In the Add Supplier dialog box, enter the details related to new supplier.
Then, click Save.
Purchase date: click the box and select the purchase date.
To delete a purchase date previously configured, click Delete icon (
).Calibration certificates: in the Calibration certificates box, select the necessary calibration certificate.
To add a new calibration certificate, click Add icon (
).In the Add Calibration Certificate dialog box, enter the following details related to new calibration certificate:
Calibration procedure (*): type the name of the Calibration procedure used to calibrate the transducer.
Calibration system: calibration system of the current calibration certificate. It is the traceability information for the selected transducer with a known accuracy, higher than the expected device under calibration and certificated according the same standard for which the calibration certification is claimed for the device under test.
Calibration system S/N: type the serial number of the system used to calibrate the transducer.
Reference transducer: traceability information for the transducer device used to calibrate a measuring device under test, where the sensitivity and the precision is proved and certified so that its output can be used as reference values for the comparisons in the calibration procedure.
Reference transducer S/N: type the serial number of the reference transducer used.
Certificate number: type the number of the calibration certificate.
Certificate link (attachment): attachment box for any document related to the calibration certificate.
Certificate date: enter the date of the emission of the certificate.
Certification expiry date (*): enter the expiry date of the calibration certificate.
Laboratory: name of the laboratory where the calibration certificate was done.
Laboratory accreditation ID: type the accreditation identification number of the laboratory where the calibration certificate was done.
Accreditation body: type the name of the accreditation body. The Accreditation body is the independent body that assessed the laboratory for the conformity to the reference standard.
Then, click Save.
To edit a calibration certificate already configured, in the Calibration certificates box, select it.
Click Edit icon (
).In the Edit Calibration Certificate dialog box, edit the calibration certificate.
Then, click Save.
To delete a calibration certificate already configured, in the Calibration certificates box, select it.
Then, click Delete icon (
).Measuring devices: in the Measuring devices box, select the necessary measuring device.
To add a new measuring device, click Add icon (
).In the Add Measuring Device dialog box, enter the details related to new measuring device.
To select a measuring device already configured, click Search icon (
).Then, click Save.
In the Measuring devices workspace, select the necessary measuring device.
Then, click Apply.
To delete a measuring device already configured, in the Measuring devices box, select it.
Then, click Delete icon (
).Notes: if necessary, type a note.
Items marked with an asterisk (*) are required.
Cloning a Transducer Details card
On the upper-right corner of the Transducer Details card, click Clone.
The Add Transducer dialog box automatically opens with all the items configured as in the Transducer Details card cloned.
If necessary, in the Add Transducer dialog box, make the necessary changes.
On the upper-right corner of the Add Transducer dialog box, click Save.
Setting the transducer filter
On the left-side menu bar, click Main Data > Transducers.
On the upper-right corner of the Transducers workspace, click Filter.
In the Transducer Filter dialog box, set the transducer filter criteria (depending on the customer needs).
On the upper-right corner of the Transducer Filter dialog box, click Apply.
Transducer filter criteria
Name: type the name of the transducer to be filtered.
Serial number: type the serial number of the transducer to be filtered.
Identifier: type the identification code linked to the transducer to be filtered.
Status: select one of the following options, depending on the status of the transducer to be filtered:
In use: select the transducer ready to work on the production applications.
Service/Repair: the transducer cannot be used on the assembly line before maintenance is complete. The capability of the transducer is verified according to customer’s procedures.
Scrapped/Disabled: select the transducer out of order. Do not use it on the assembly line.
Models: in the Models box, select the transducer model to be filtered.
To select a transducer model, click Search icon (
).In the Transducer Models workspace, select the necessary transducer model.
Then, click Apply.
To delete a transducer model, in the Models box, select it.
Then, click Delete icon (
).Measuring devices: in the Measuring devices box, select the necessary measuring device.
To select a measuring device, click Search icon (
).In the Measuring Devices workspace, select the necessary measuring device.
Then, click Apply.
To delete a measuring device, in the Measuring devices box, select it.
Then, click Delete icon (
).Selected filter: from the drop-down list, select one of the saved customized filter.
For more information on how to manage customized filters, refer to Filters customization.
Joints
On the left-side menu bar, click Main Data > Joints.
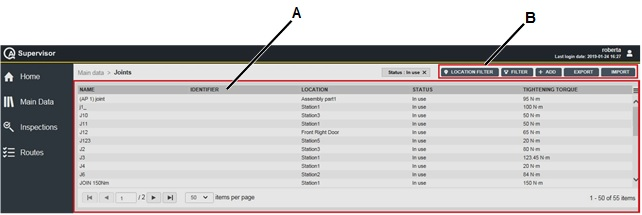
A | Joints workspace | B | Command buttons |
The Joint workspace is divided into the following columns:
Name: name of the joint.
Identifier: custom identification code linked to the current joint.
Location: area of the plant where using the joint.
Status: below are the available options, depending on the status of the joint:
In use: the joint is in working condition.
Scrapped/Disabled: the joint is out of order.
Tightening torque: target torque defined in the production process to tighten the joint.
In the Joint workspace, click a joint to display the related Joint Details card.
On the upper-right corner of the Joint Details card, click the Close button to exit the Joint Details card (without saving any change).
At the end of the Joint Details card, the following items record all of the changes made for the selected joint:
History: the history table records all of the changes made for the selected joint.
The first line of the history table summarizes the latest version of the joint configuration.
Click a previous line: the related Joint Details card opens on the left of the Joint Details card related to the latest version. The differences between the two Joint Details cards are yellow highlighted.
On the upper-right corner of the oldest Joint Details card, click Restore: the previous version of the joint configuration becomes the latest one.
Version: version of the joint configuration.
In the Edit Joint dialog box, change one of the following items to make a new version: Identifier , Location, Status, Risk/Function class, Geometry, Material surface, Lubricant, Bolt type, Size, Strength grade, Friction coefficient, Assembly pre-load, Yield point stress, Tightening torque, Torque tolerance limits, Torsion angle, Angle tolerance limits, and Final angle monitoring torque.
Changed by: name of the operator who has made a change to the joint configuration.
Changed on: optional field, it appears only if the change was made by an operator on a device.
On the upper-right corner of the Joint workspace, there are the following command buttons:
Import: click to import joints into the Joints workspace
Export: click to export t he joint configured in the application
Add: click to add a new transducer into the Joint workspace.
Filter: click to give filters and list only the necessary joint(s).
Location Filter: click to filter the joint(s) depending on its location in the factory structure.
The Import and Export button are available only if the roles for importing and exporting data are enabled. Refer to the Roles paragraph for more information.
Adding a joint
On the left-side menu bar, click Main Data > Joint.
On the upper-right corner of the Joint workspace, click Add.
In the Add Joint dialog box, configure the Joint parameters.
On the upper-right corner of the Add Joint dialog box, click Save.
Editing a Joint Details card
On the upper-right corner of the Joint Details card, click Edit.
In the Edit Joint dialog box, make the necessary changes.
In the upper-right corner of the Edit Joint dialog box, click Save.
Joint parameters
Joint image: upload the image of the joint model.
Name (*): type the name of the joint.
Description: type a description of the joint.
Identifier: type the identification code linked to the joint.
Location (*): select the area of the plant where using the new joint.
Do as follows:
Click Location icon (
).In the Location dialog box, select the area of the plant where using the new joint.
Then, click Apply.
Status (*): select one of the following options, depending on the status of the joint:
In use: the joint is ready to work on the production applications.
Scrapped/Disabled: the joint is out of order.
By default, the status is set to In use
Risk/Function class: select one of the following options:
A: direct or indirect danger to body and life.
B: breakdown.
C: customer’s nerves.
Measurement unit: select the measurement unit to define the torque parameters of the joint.
Trace
Trace: add/select a trace to be linked to the joint.
Do one of the following:Click Add icon (
) to add a new trace.
In the Add Trace card, enter the details related to the trace and import the traces.
Then, click Save. The trace added is displayed in the chart.Click Search icon (
) to select a trace already configured.
In the Trace Title card, select the necessary trace.
Then, click Apply. The trace selected is displayed in the chart.Click Delete icon (
) to delete the selected trace.
Tightening
Torque (*): type the tightening torque of the joint.
The torque value can be given as follows:
Torque target and torque tolerance.
Lower limit (LSL) and upper limit (USL).
Torque tolerance (*): type the percentage of the torque tolerance limits.
Tightening direction (*): select one of the following options:
CW: clockwise.
CCW: counter-clockwise.
Torsion angle (*): type the target torsion angle of the joint.
Even if the tightening in production is only torque, indication of the target angle is used to define the joint characteristics.The torsion angle can be given as follows:
Torsion angle and torsion angle tolerance (by default 270° and 90° respectively).
Lower limit (LSL) and upper limit (USL) (by default 180° and 360° respectively).
Final angle monitoring torque (*): the final angle monitoring torque specifies the torque value from which the angle measurement starts.
For older products, this item is indicated as Start final angle.Assembly pre-load: bolt clamp force applied on the joint.
Tools: in the Tools box, select the necessary tool.
To add a new tool, click Add icon (
).In the Add Tool dialog box, enter the details related to new tool. Then, click Save.
To select a tool already configured, click Search icon (
).In the Tools workspace, select the necessary tool. Then, click Apply.
To delete a tool already configured, in the Tool box, select it. Then, click Delete icon (
).To view the Tool Details card of a tool already configured, in the Tool box, select it. Then, click View icon (
 ).
).
Bolt
Geometry: in the items list, select the geometry of the bolt.
Configure the items list in the Selectables submenu.
Material and surface: in the items list, select the material and surface of the bolt.
Configure the items list in the Selectables submenu.
Lubricant: in the items list, select the lubricant of the bolt.
Configure the items list in the Selectables submenu.
Bolt type: in the items list, select the bolt type.
Configure the items list in the Selectables submenu.
Size: in the items list, select the size of the bolt.
Configure the items list in the Selectables submenu.
Strength grade: in the items list, select the strength grade of the bolt.
Configure the items list in the Selectables submenu.
Friction coefficient, µ: in the items list, select the friction coefficient of the bolt.
Configure the items list in the Selectables submenu.
Yield stress point: in the items list, select the yield stress point of the bolt.
Configure the items list in the Selectables submenu.
Utilization factor, v: this item shows the ratio between Tightening torque and Yield stress point.
Configure the items list in the Selectables submenu.
Notes: if necessary, type a note.
Items marked with an asterisk (*) are required.
Cloning a Joint Details card
On the upper-right corner of the Joint Details card, click Clone.
The Add Joint dialog box automatically opens with all the items configured as in the Joint Details card cloned.
If necessary, in the Add Joint dialog box, make the necessary changes.
On the upper-right corner of the Add Joint dialog box, click Save.
Setting the joint filter
On the left-side menu bar, click Main Data > Joints.
On the upper-right corner of the Joints workspace, click Filter.
In the Joint Filter dialog box, set the joint filter criteria (depending on the customer needs):
On the upper-right corner of the Joints Filter dialog box, click Apply.
Adding a Joint inspection
On the upper-right corner of the Joint details card, click on the Inspections button.
On the upper-right corner of the Inspection Definition card, click on the Add button.
In the Add inspection definition dialog box, configure the inspection parameters.
On the upper-right corner of the Add inspection definition dialog box, click on the Save button.
Running a Joint inspection
On the upper-right corner of the Joint details card, click on the Inspections button.
In the Inspection Definition card, click on an Inspection from the list.
In the Inspection Definition Details card, click on the Run button to send the selected inspection to the measuring device configured in the Personal settings.
If no measuring device is configured in the Personal settings, the Run button is disabled.
To configure a measuring device, please refer to the paragraph "Viewing/editing personal settings".
If the inspection is correctly sent to the measuring device, a green notification message is displayed.
If the inspection is not sent to the measuring device, an error message alerts the user about the problem that occurred.
This functionality sends the inspection to the measuring device and runs it, the success of the running operation has to be verified on the measuring device.
Joint filter criteria
Name: type the name of the joint to be filtered.
Identifier: type the identification code linked to the joint to be filtered.
Status: select one of the following options, depending on the status of the joint to be filtered:
In use: select the joint ready to work on the production applications.
Scrapped/Disabled: select the joint out of order. Do not use it on the assembly line.
Tools: in the Tools box, select the tool to be filtered.
To select a tool, click Search icon (
).In the Tools workspace, select the necessary tool.
Then, click Apply.
To delete a tool selected previously, in the Tools box, select it.
Then, click Delete icon (
).Selected filter: from the drop-down list, select one of the saved customized filter.
For more information on how to manage customized filters, refer to Filters customization.
Exporting data
On the upper-right corner of the page, click Export.
An Excel file is created with all the configured data.
If some filters are applied to the list, only the filtered items are exported.
All the saved information are exported, except the pictures.
Importing data
On the upper-right corner of the page, click Export. An Excel file is created.
If the page is empty, the export file is created with all the fields empty.
Save the Excel file created by the application.
Open the Excel file and add/edit the items of interest following the rules listed at the end of the procedure.
Save the edited file.
On the upper-right corner of the page, click Import. Then select the file to import from the upload window and click Open.
If some errors occurred during the import, a yellow message is displayed and an Excel file with all the not imported rows is created.
The description on the error occurred for each rows is displayed at the last columns on the right of the Excel file.
Open the excel file with the list of error and correct them following the rules listed below.
Save the edit file.
On the upper-right corner of the page, click Import. Then select the file to import from the upload window and click Open.
Repeat the step from 7 to 9 until all the errors are corrected.
The “Internal ID” column determines if the data is new or an update of existing ones. If set to empty, it is new data, if left with exported value, it is an update.
To edit the export file:
Do not delete or edit the header of the columns.
Do not change the order of the columns of the exported file.
Do not add other sheet to the exported file.
Do not change the name of the sheet of the exported file.
Do not change the file format.
To delete an entire row of the exported file: select the row, right-click it and select Delete.
It is allowed to change the file name.
The columns of the exported file are independent. If a unit of measurement is changed, the related numerical value is not converted.
Joint report
The Joint report can combine data coming from different applications: Tool Check, Joint Check and, optionally, Production readings coming from ToolsNet 8
This report is available only if the Joint report license is activated.
Setting the Joint report filter
On the left-side menu, select Main data > Joints.
In the Joints page, select a joint linked to a tool.
If the Joint is not linked to any tool, the joint report function is not available.
In the Joint details card, click the Joint report button.
In the Joint report filters card, set the joint report filter criteria.
On the upper-right corner of the Joint report filters, click Apply.
Joint report filter criteria
As to date: date up to which to collect the results saved by ToolsNet 8 and QA Supervisor.
Tool check
Tools: list of the tools linked to the joint. By default, all the tools are selected. Click the Tool not to include in the Joint report.
Inspections: list of the Cm/Cmk position based inspections linked to the selected tools, listed in the Tools box.
Number of results (*): type the number of single results for each selected inspections. For each inspection, the last execution (on the expiry date) is retrieved.
Joint check
Inspections: select the production inspection to include in the Joint report. Only the inspections linked to the joint are shown.
Number of results (*): type the number of measures to retrieve for each inspection used in the Joint report. For each inspection, the last execution (on the expiry date) is retrieved.
Production data
Tightening programs: select the production programs to include in the Joint report.
This box lists the production programs for which at least a result exists for the selected tools.
Number of results (*): type the number of tightening results for each tightening program. For each inspection. the results of the last execution are shown.
Sampling frequency (*): type the frequency of the results using in the Joint report statistics.
Sampling frequency = 1: all the results are considered.
Sampling frequency = 2: one result every 2 results is considered.
Sampling frequency = X: one result every X results is considered.
Joint report preview
After setting the Joint report filters, on the upper-right corner of the Joint report filters card, click the Apply button.
The Joint report preview card opens.
The card is divided in different sections:
Graphs for torque and angle that display the results of the last test run for all the selected inspections (tool check, joint check and Pset from the production). The red dashed line represent the limits defined in the selected joint check inspection.
Cm/Cmk: for each tool check inspection, the general information (results data, measuring device, target object, result status), graphs of the last test run and of the deviation from the normal distribution, and the statistics about the inspection are shown.
Cp/Cpk - SPC: for the selected joint check inspection, the general information (results data, measuring device, target object, result status), graphs of the last test run and of the deviation from the normal distribution, and the statistics about the inspection are shown.
The general information and the statistics are displayed only for the quality inspections (not for the production results).
If a measure is NOK, the normal distribution and the probability plot chart are not displayed.
Exporting the Joint report
In the upper-right corner of the Joint report preview card:
click the Simple report button to export a file with all the graphs and the data displayed in the Joint report preview card.
click Full report button to export a .zip file that include:
a file with all the Joint data, the graphs displayed in the Joint report preview card
a file with the table with all the single results displayed in the graphs
a file with the report of each single quality inspection
The default report format is defined in the Application settings and in the Personal settings.
Auditing a Joint
On the upper-right corner of the Joint Details card, click Audit.
A report file containing information on the selected joint such as: joint details, inspection definition details (joint check and tool check position based) and inspection result details is created. The information in the report are presented in chronological descending order.
The default report format is defined in the Application settings and in the Personal settings.
Tools
On the left-side menu bar, click Main Data > Tools.
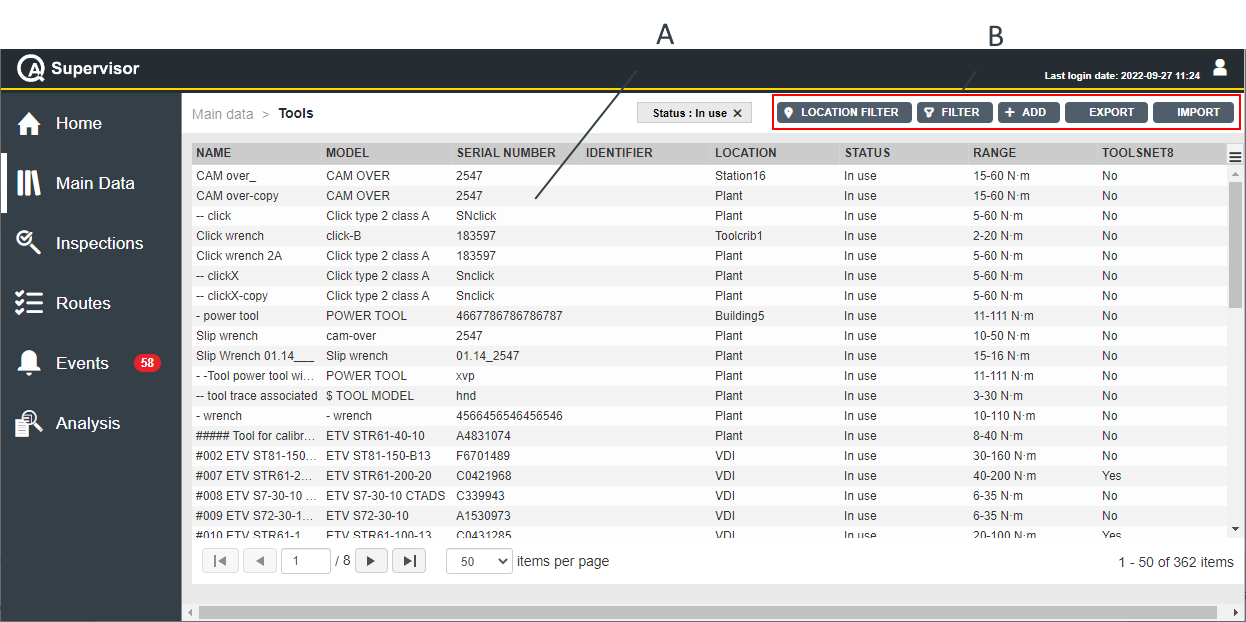
A | Tools workspace | B | Command buttons |
The Tools workspace is divided into the following columns:
Name: name of the tool.
Model: model of the tool.
Serial number: serial number of the tool.
Identifier: custom identification code linked to the current tool.
Location: area of the plant where using the tool.
Status: below are the available options, depending on the status of the tool:
In use: in working condition and currently used in production applications
Backup: the tool is not currently used but it is ready to replace an operating tool on the assembly line.
Toolcrib: the tool is stored in the toolcrib. It is waiting for the assignment to a production location depending on the incoming production needs. Do a tool check before a regular usage on the assembly line.
Service/Repair: the tool cannot be used on the assembly line before maintenance is complete. The capability of the tool is verified according to customer’s procedures.
Scrapped/Disabled: the tool is out of order. Do not use it on the assembly line.
Range: torque range of the tool.
Toolsnet8: yes if the tool exists in ToolsNet 8, no otherwise.
In the Tools workspace, click a tool to display the related Tool Details card.
On the upper-right corner of the Tool Details card, click the Close button to exit the Tool Details card (without saving any change).
On the upper-right corner of the Tool Details card, click Inspections Definitions to view the inspection(s) linked to the selected tool. In the Inspections Definitions workspace, click an inspection to open the related Inspection Definition Details card.
On the upper-right corner of the Tool Details card, click Swap to perform a tool swap operation and replace the selected tool. For further information, refer to Performing a tool swap operation.
The Swap button is not available for tools without a Tool model assigned, or with the Tool model set to Generic. For further information, refer to Tool parameters.
At the end of the Tool Details card, the following items record all of the changes made for the selected tool:
History: the history table records all of the changes made for the selected tool.
The first line of the history table summarizes the latest version of the tool configuration.
Click a previous line: the related Tool Details card opens on the left of the Tool Details card related to the latest version.
The differences between the two Tool Details cards are yellow highlighted.
On the upper-right corner of the oldest Tool Details card, click Restore: the previous version of the tool configuration becomes the latest one.
Version: version of the tool configuration.
In the Edit Tool dialog box, change one of the following items to make a new version: Serial number, Identifier, Location, and Status.
Changed by: name of the operator who has made a change to the tool configuration.
On the upper-right corner of the Tools workspace, there are the following command buttons:
Import: click to tools into the Tools workspace.
The Tools configured with a custom status are not imported.
Export: click to export the tool configured in the application.
Add: click to add a new tool into the Tool workspace.
Filter: click to give filters and list only the necessary tool(s).
Location Filter: click to filter the tool(s) depending on its location in the factory structure.
The Import and Export button are available only if the roles for importing and exporting data are enabled. Refer to the Roles paragraph for more information.
Adding a Tool
On the left-side menu bar, click Main Data > Tools.
On the upper-right corner of the Tools workspace, click Add.
In the Add Tool dialog box, configure the Tool parameters.
On the upper-right corner of the Add Tool dialog box, click Save.
Editing a Tool
On the upper-right corner of the Tool Details card, click Edit.
In the Edit Tool dialog box, make the necessary changes.
On the upper-right corner of the Edit Tool dialog box, click Save.
It is not possible to change the Tool model.
Tool parameters
Name (*): type the name of the tool.
Description: type a description of the tool.
Model (*): add/select the tool model.
Do one of the following:Click Add icon (
) to add a new tool model.
In the Add Tool Model dialog box, enter the details related to new tool.
Then, click Save.Click Search icon (
) to select a tool model already configured.
In the Tool Model workspace, select the necessary tool model.
Then, click Apply.
If Tool model is set to Generic, the tool can not be linked to joints, controllers and inspections. If these links are created, an error message is displayed
Serial number (*): type the serial number of the tool.
Identifier: type the identification code linked to the tool.
Location (*): select the area of the plant where using the new tool model. By default it is set to the is the location of the user.
Do as follows:
Click Location icon ().
In the Location dialog box, select the area of the plant where using the new tool model.
Then, click Apply.Status (*): select one of the following options, depending on the status of the tool:
In use: the tool is ready to work on the production applications.
Backup: the tool is not currently used but it is ready to replace an operating tool on the assembly line.
Toolcrib: the tool is stored in the toolcrib. It is waiting for the assignment to a production location depending on the incoming production needs. Do a tool check before a regular usage on the assembly line.
Service/Repair: the tool cannot be used on the assembly line before maintenance is complete. The capability of the tool is verified according to customer’s procedures.
Scrapped/Disabled: the tool is out of order. Do not use it on the assembly line.
At the end of the list, all the enabled custom status configured by the user are displayed.
The user can configure the custom status in the Application settings page.
By default, the status is set to In use.
ToolsNet8: yes if the tool exists in ToolsNet 8, no otherwise.
ToolsNet 8 is a read-only value.
Supplier: click the arrow to open the supplier list and select the necessary supplier.
To add a new supplier, click Add icon ().
In the Add Supplier dialog box, enter the details related to new supplier.
Then, click Save.Purchase date: click the box and select the purchase date.
To delete a purchase date previously configured, click Delete icon ().Joints: in the Joints box, select the necessary joint.
To add a new joint, click Add icon ().
In the Add Joint dialog box, enter the details related to new joint.
Then, click Save.
To select a joint already configured, click Search icon ().
In the Joints workspace, select the necessary joint.
Then, click Apply.
To view the Joint Details card of a joint already configured, in the Joint box, select it.
Then, click View icon ().
To delete a joint already configured, in the Joint box, select it.
Then, click Delete icon ().
Joints can be linked only to tools whose status is either In use, Backup or Toolcrib.
Notes: if necessary, type a note.
Items marked with an asterisk (*) are required.
Controller unit
Controller unit: add/select the controller unit.
Do one of the following:Click Add icon (
) to add a new controller unit.
In the Add Controller Unit dialog box, enter the details related to new controller unit.
Then, click Save.Click Search icon (
) to select a controller unit already configured.
In the Controller Units workspace, select the necessary controller unit.
Then, click Apply.Click Delete icon (
) to delete a controller unit already configured.
Controllers' data can be linked only to tools whose status is either In use, Backup or Toolcrib.
By selecting an already existing Controller unit, the information on the connectivity are automatically populated and cannot be edited.
Controller unit type (*): from the drop-down list select among:
Power Focus
PowerMACS
Generic
Open Protocol
Then, configure the following parameters:
Serial number (*): type the serial number of the controller.
Type (*): select between Ethernet or Serial.
Baud rate: The baud rate is the data transmission speed set for the communication between the controller and the host.
Select one of the following options:9600
19200
38400
57600
115200
Host: type the host address of the controller.
Port: type the port to communicate with the controller.
Cloning a Tool Details card
On the upper-right corner of the Tool Details card, click Clone.
The Add Tool dialog box automatically opens with all the items configured as in the Tool Details card cloned.
If necessary, in the Add Tool dialog box, make the necessary changes.
On the upper-right corner of the Add Tool dialog box, click Save.
Adding a Tool inspection
On the upper-right corner of the Tool details card, click on the Inspections button.
On the upper-right corner of the Inspection Definition card, click on the Add button.
In the Add inspection definition dialog box, configure the inspection parameters.
On the upper-right corner of the Add inspection definition dialog box, click on the Save button.
Running a Tool inspection
On the upper-right corner of the Tool details card, click on the Inspections button.
In the Inspection Definition card, click on an Inspection from the list.
In the Inspection Definition Details card, click on the Run button to send the selected inspection to the measuring device configured in the Personal settings.
If no measuring device is configured in the Personal settings, the Run button is disabled.
To configure a measuring device, please refer to the paragraph "Viewing/editing personal settings".
If the inspection is correctly sent to the measuring device, a green notification message is displayed.
If the inspection is not sent to the measuring device, an error message alerts the user about the problem that occurred.
This functionality sends the inspection to the measuring device and runs it, the success of the running operation has to be verified on the measuring device.
Setting Tool filter
On the left-side menu bar, click Main Data > Tools.
On the upper-right corner of the Tools workspace, click Filter.
In the Tools Filter dialog box, set the tool filter criteria (depending on the customer needs):
On the upper-right corner of the Tools Filter dialog box, click Apply.
Tool filter criteria
Name: type the name of the tool to be filtered.
Serial number: type the serial number of the tool to be filtered.
Identifier: type the identification code linked to the tool to be filtered.
Status: select one of the following options, depending on the status of the tool to be filtered:
In use: select the tool ready to work on the production applications.
Backup: the tool is not currently used but it is ready to replace an operating tool on the assembly line.
Toolcrib: the tool is stored in the toolcrib. It is waiting for the assignment to a production location depending on the incoming production needs. Do a tool check before a regular usage on the assembly line.
Service/Repair: the tool cannot be used on the assembly line before maintenance is complete. The capability of the tool is verified according to customer’s procedures.
Scrapped/Disabled: select the tool is out of order.
At the end of the list, all the enabled custom status configured by the user are displayed.
The user can configure the custom status in the Application settings page.
If a Custom status is disabled in the Application settings page, all the tools with this status remain unchanged but it is not possible to filter them (the custom status is not listed in the Status drop down list).
Models: in the Models box, select the tool model to be filtered.
To select a tool model, click Search icon (
).In the Tool Models workspace, select the necessary tool model. Then, click Apply
To delete a tool model, in the Models box, select it. Then, click Delete icon (
).Controller units: in the Controller Units box, select the necessary controller.
To select a controller, click Search icon (
).In the Controller Units workspace, select the necessary controller. Then, click Apply
To delete a controller, in the Controller Units box, select it. Then, click Delete icon (
).Joints: in the Joints box, select the necessary joint.
To select a joint, click Search icon (
).In the Joints workspace, select the necessary joint. Then, click Apply
.
To delete a joint, in the Joints box, select it. Then, click Delete icon (
).Selected filter: from the drop-down list, select one of the saved customized filter.
For more information on how to manage customized filters, refer to Filters customization.
Exporting data
On the upper-right corner of the page, click Export.
An Excel file is created with all the configured data.
If some filters are applied to the list, only the filtered items are exported.
All the saved information are exported, except the pictures.
Importing data
On the upper-right corner of the page, click Export. An Excel file is created.
If the page is empty, the export file is created with all the fields empty.
Save the Excel file created by the application.
Open the Excel file and add/edit the items of interest following the rules listed at the end of the procedure.
Save the edited file.
On the upper-right corner of the page, click Import. Then select the file to import from the upload window and click Open.
If some errors occurred during the import, a yellow message is displayed and an Excel file with all the not imported rows is created.
The description on the error occurred for each rows is displayed at the last columns on the right of the Excel file.
Open the excel file with the list of error and correct them following the rules listed below.
Save the edit file.
On the upper-right corner of the page, click Import. Then select the file to import from the upload window and click Open.
Repeat the step from 7 to 9 until all the errors are corrected.
The “Internal ID” column determines if the data is new or an update of existing ones. If set to empty, it is new data, if left with exported value, it is an update.
To edit the export file:
Do not delete or edit the header of the columns.
Do not change the order of the columns of the exported file.
Do not add other sheet to the exported file.
Do not change the name of the sheet of the exported file.
Do not change the file format.
To delete an entire row of the exported file: select the row, right-click it and select Delete.
It is allowed to change the file name.
The columns of the exported file are independent. If a unit of measurement is changed, the related numerical value is not converted.
Auditing a Tool
On the upper-right corner of the Tool Details card, click Audit.
A report file containing information on the selected tool (such as tool details, inspection definition details, inspection result details) is created. The information in the report are presented in chronological descending order.
The default report format is defined in the Application settings and in the Personal settings.
Controller units
On the left-side menu bar, click Main Data > Controller units.
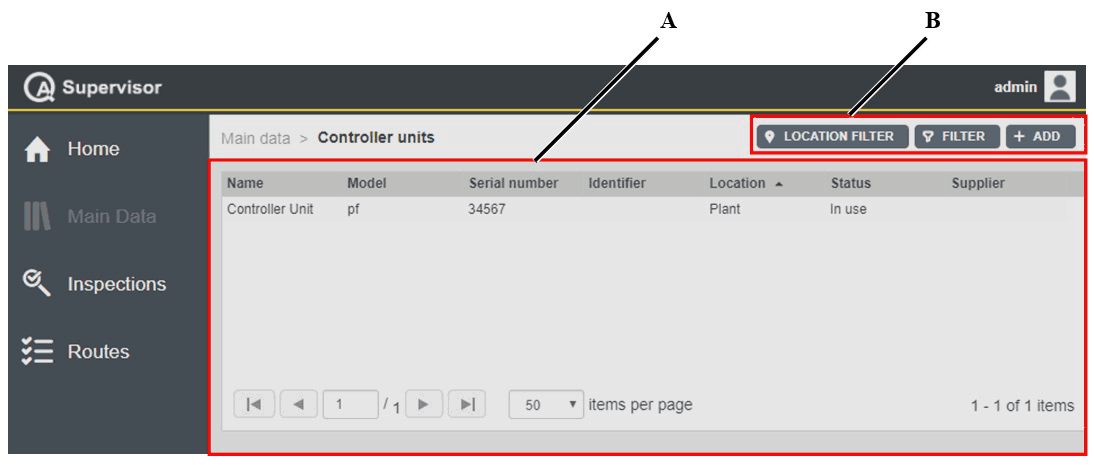
A | Controller units workspace | B | Command buttons |
The Controller units workspace is divided into the following columns:
Name: name of the controller.
Model: model of the controller.
Serial number: serial number of the controller.
Identifier: custom identification code linked to the current controller.
Location: area of the plant where using the controller.
Status: below are the available options, depending on the status of the controller:
In use: the controller is ready to work on the production applications.
Service/Repair: the controller cannot be used on the assembly line before maintenance is complete. The capability of the controller is verified according to customer’s procedures.
Scrapped/Disabled: the controller is out of order. Do not use it on the assembly line.
Supplier: supplier of the controller.
In the Controller units workspace, click a controller to display the related Controller Unit Details card.
On the upper-right corner of the Controller Unit Details card, click the Close button to exit the Controller Unit Details card (without saving any change).
At the end of the Controller Unit Details card, the following items record all of the changes made for the selected controller:
Version: version of the controller configuration.
In the Edit Controller Unit dialog box, change one of the following items to make a new version: Controller unit, Serial number, Identifier, Location, Location history, and Status.
Changed by: name of the operator who has made a change to the controller configuration.
History: the history table records all of the changes made for the selected controller.
The first line of the history table summarizes the latest version of the controller configuration.
Click a previous line: the related Controller Unit Details card opens on the left of the Controller Unit Details card related to the latest version.
The differences between the two Controller Unit Details cards are yellow highlighted.
On the upper-right corner of the oldest Controller Unit Details card, click Restore: the previous version of the controller unit configuration becomes the latest one.
On the upper-right corner of the Controller units workspace, there are the following command buttons:
Add: click to add a new controller into the Controller units workspace.
Filter: click to give filters and list only the necessary controller(s).
Location Filter: click to filter the controller(s) depending on its location in the factory structure.
Adding a controller unit
On the left-side menu bar, click Main Data > Controller units.
On the upper-right corner of the Controller units workspace, click Add.
In the Add Controller Unit dialog box, configure the Controller unit parameters.
On the upper-right corner of the Add Controller Unit dialog box, click Save.
Editing a Controller Unit Details card
On the upper-right corner of the Controller Unit Details card, click Edit.
In the Edit Controller Unit dialog box, make the necessary changes.
On the upper-right corner of the Edit Controller Unit dialog box, click Save.
Controller unit parameters
Name (*): type the name of the controller unit.
Description: type a description of the controller unit.
Model (*): add/select the controller model.
Do one of the following:Click Add icon (
) to add a new controller unit model.
In the Add Controller Model dialog box, enter the details related to new controller unit.
Then, click Save.Click Search icon (
) to select a controller model already configured.
In the Controller Models workspace, select the necessary controller model.
Then, click Apply.
Controller unit type (*): from the drop-down list select among:
Power Focus
PowerMACS
Generic
Open Protocol
Serial number (*): type the serial number of the controller.
Identifier: type the identification code linked to the controller.
Location (*): select the area of the plant where using the new controller model. By default it is set to the is the location of the user.
Do as follows:
Click Location icon ().
In the Location dialog box, select the area of the plant where using the new controller model.
Then, click Apply.Status (*): select one of the following options, depending on the status of the controller:
In use: the controller is ready to work on the production applications.
Service/Repair: the controller cannot be used on the assembly line before maintenance is complete. The capability of the controller is verified according to customer’s procedures.
Scrapped/Disabled: the controller is out of order. Do not use it on the assembly line.
By default, the status is set to In use
Connectivity
Type (*): select between Ethernet or Serial.
Baud rate: The baud rate is the data transmission speed set for the communication between the controller and the host.
Select one of the following options:9600
19200
38400
57600
115200
Host: type the host address of the controller.
Port: type the port to communicate with the controller.
Tools: in the Tools box, select the necessary tool.
To add a new tool, click Add icon ().
In the Add Tool dialog box, enter the details related to new tool. Then, click Save.
To select a tool already configured, click Search icon ().
In the Tools workspace, select the necessary tool. Then, click Apply.
To delete a tool already configured, in the Tool box, select it.
Then, click Delete icon ().Supplier: click the arrow to open the supplier list and select the necessary supplier.
To add a new supplier, click Add icon ().
In the Add Supplier dialog box, enter the details related to new supplier.
Then, click Save.Purchase date: click the box and select the purchase date.
To delete a purchase date previously configured, click Delete icon ().Notes: if necessary, type a note.
Items marked with an asterisk (*) are required.
Cloning a Controller Unit Details card
On the upper-right corner of the Controller Unit Details card, click Clone.
The Add Controller Unit dialog box automatically opens with all the items configured as in the Controller Unit Details card cloned.
If necessary, in the Add Controller Unit dialog box, make the necessary changes.
On the upper-right corner of the Add Controller Unit dialog box, click Save.
Setting the controller unit filter
On the left-side menu bar, click Main Data > Controller units.
On the upper-right corner of the Controller units workspace, click Filter.
In the Controller Units Filter dialog box, set the controller unit filter criteria (depending on the customer needs):
On the upper-right corner of the Controller Units Filter dialog box, click Apply.
Controller unit filter criteria
Name: type the name of the controller to be filtered.
Serial number: type the serial number of the controller to be filtered.
Identifier: type the identification code linked to the controller to be filtered.
Status: select one of the following options, depending on the status of the controller to be filtered:
In use: select the controller ready to work on the production applications.
Service/Repair: the controller cannot be used on the assembly line before maintenance is complete. The capability of the controller is verified according to customer’s procedures.
Scrapped/Disabled: select the controller is out of order.
Models: in the Models box, select the controller model to be filtered.
To select a transducer model, click Search icon (
).In the Transducer Models workspace, select the necessary transducer model.
Then, click Apply.
To delete a transducer model, in the Models box, select it.
Then, click Delete icon (
).Tools: in the Tools box, select the necessary tool.
To select a tool, click Search icon (
).In the Tools workspace, select the necessary tool.
Then, click Apply.
To delete a tool, in the Tools box, select it.
Then, click Delete icon (
).Selected filter: from the drop-down list, select one of the saved customized filter.
For more information on how to manage customized filters, refer to Filters customization.
Measuring device models
On the left-side menu bar, click Main Data > Measuring device models.
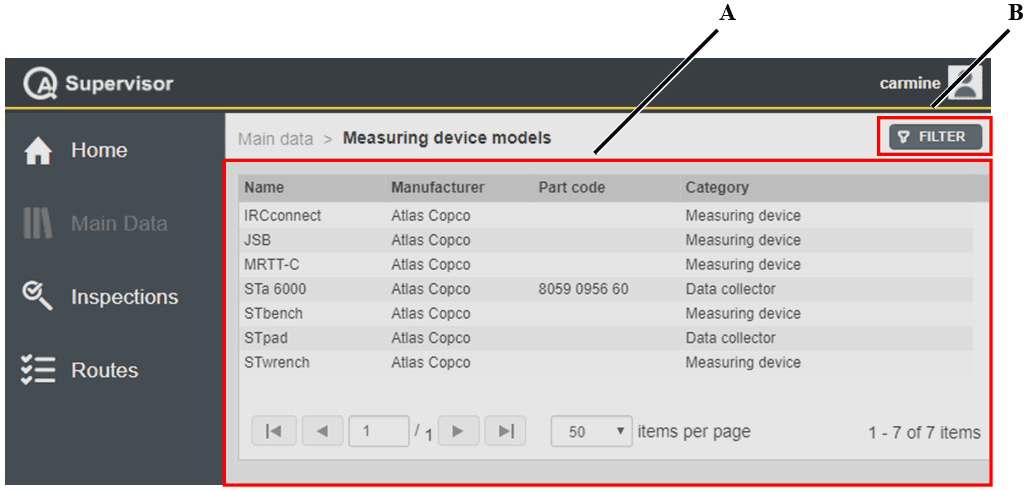
A | Measuring device models workspace | B | Command button |
The Measuring device models workspace is divided into the following columns:
Name: name of the measuring device.
Manufacturer: name of the manufacturer of the measuring device.
Part code: part code of the measuring device.
Category: category identifying the measuring device.
In the Measuring device models workspace, click a measuring device model to display the related Measuring Device Model Details card.
On the upper-right corner of the Measuring device models workspace, there is the following command button:
Filter: click to give filters and list only the necessary measuring device model(s).
Setting the measuring device models filter
On the left-side menu bar, click Main Data > Measuring device models.
On the upper-right corner of the Measuring device models workspace, click Filter.
In the Measuring Device Models Filter dialog box, set the measuring device model filter criteria (depending on the customer needs):
On the upper-right corner of the Measuring Device Models Filter dialog box, click Apply.
Measuring device model filter criteria
Name: type the name of the measuring device model to be filtered.
Manufacturer: in the drop-down list, select the manufacturer (of the measuring device model) to be filtered.
Part code: type the part code of the measuring device model to be filtered.
Category: in the drop-down list, select the category (of the measuring device model) to be filtered.
Status: in the drop-down list, select the status (of the measuring device model) to be filtered.
Selected filter: from the drop-down list, select one of the saved customized filter.
For more information on how to manage customized filters, refer to Filters customization.
Transducer models
On the left-side menu bar, click Main Data > Transducer models.
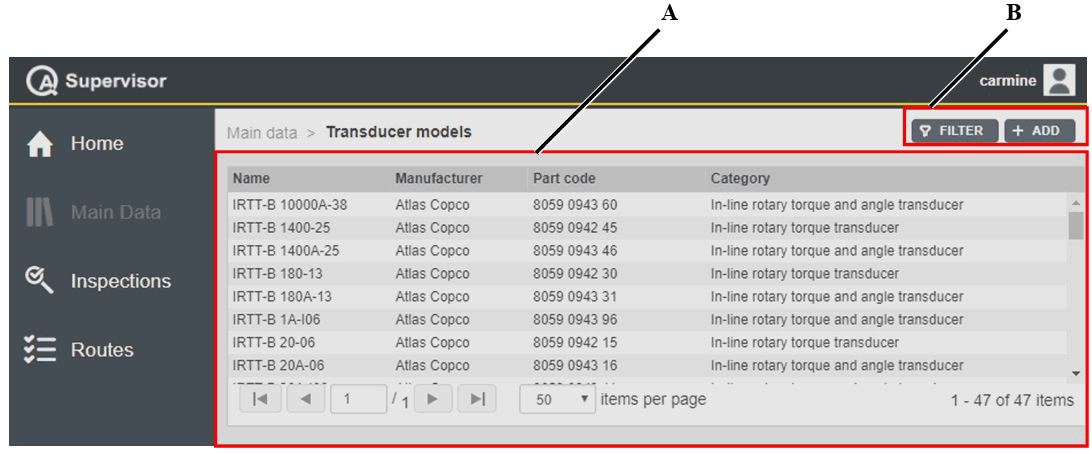
A | Transducer models workspace | B | Command buttons |
The Transducer models workspace is divided into the following columns:
Name: name of the transducer model.
Manufacturer: name of the manufacturer of the transducer model.
Part code: part code of the transducer model.
Category: category identifying the transducer model.
In the Transducer models workspace, click a transducer model to display the related Transducer Model Details card.
On the upper-right corner of the Transducer Model Details card, click the Close button to exit the Transducer Model Details card.
On the upper-right corner of the Transducer models workspace, there are the following command buttons:
Add: click to add a new transducer model into the Transducer models workspace.
Filter: click to give filters and list only the necessary transducer model(s).
Adding a transducer model
On the left-side menu bar, click Main Data > Transducer Models.
On the upper-right corner of the Transducer Models workspace, click Add.
In the Add Transducer Model dialog box, configure the Transducer model parameters.
On the upper-right corner of the Add Transducer Model dialog box, click Save.
Editing a Transducer Model Details
On the upper-right corner of the Transducer Model Details card, click Edit.
In the Edit Transducer Model dialog box, make the necessary changes.
On the upper-right corner of the Edit Transducer Model dialog box, click Save.
Transducer model parameters
Transducer image: upload the image of the transducer model.
Name (*): type the name of the transducer model.
Manufacturer (*): add/select the manufacturer of the transducer model.
Do one of the following:
Click Add icon (
) to add a new manufacturer. In the Add Manufacturer dialog box, enter the details related to new manufacturer.
Then, click Save.
In the Manufacturer drop-down list, select the manufacturer of the transducer model.
Part code: type the part code of the transducer model.
Category (*): in the Category drop-down list, select the category of the transducer model.
Capacity Range
Measurement unit: select the measurement unit to define the torque parameters of the transducer model. The default measurement unit is defined both in the Application settings and in the Personal settings.
Min (*): type the minimum torque value of the transducer model.
Max (*): type the maximum torque value of the transducer model.
Notes: if necessary, type a note.
Items marked with an asterisk (*) are required.
Setting the transducer model filter
On the left-side menu bar, click Main Data > Transducer models.
On the upper-right corner of the Transducer models workspace, click Filter.
In the Transducer Models Filter dialog box, set the transducer model filter criteria (depending on the customer needs):
On the upper-right corner of the Transducer Models Filter dialog box, click Apply.
Transducer model filtering criteria
Name: type the name of the transducer model to be filtered.
Manufacturer: in the drop-down list, select the manufacturer (of the transducer model) to be filtered.
Part code: type the part code of the transducer model to be filtered.
Category: in the drop-down list, select the category (of the transducer model) to be filtered.
Status: in the drop-down list, select the status (of the transducer model) to be filtered.
Selected filter: from the drop-down list, select one of the saved customized filter.
For more information on how to manage customized filters, refer to Filters customization.
Tool models
On the left-side menu bar, click Main Data > Tool models.
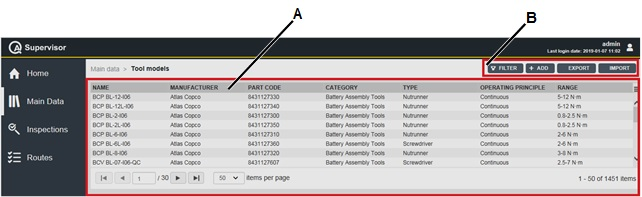
A | Tool models workspace | B | Command buttons |
The Tool models workspace is divided into the following columns:
Name: name of the tool model.
Manufacturer: name of the manufacturer of the tool model.
Part code: part code of the tool model.
Category: category identifying the tool model.
Type: type of the tool model (Screwdriver, Nutrunner, Wrench, Generic).
Operating principle: operating principle of the tool model (Continuous, Pulse, Stroke).
Range: range of the tool model.
In the Tool models workspace, click a tool model to display the related Tool Model Details card.
On the upper-right corner of the Tool Model Details card, click the Close button to exit the Tool Model Details card.
On the upper-right corner of the Tool models workspace, there are the following command buttons:
Import: click to import tool models into the Tool models workspace.
Export: click to export the tool models configured in the application.
Add: click to add a new tool model into the Tool models workspace.
Filter: click to give filters and list only the necessary tool model(s).
The Import and Export button are available only if the roles for importing and exporting data are enabled. Refer to the Roles paragraph for more information.
Adding a Tool model
On the left-side menu bar, click Main Data > Tool models.
On the upper-right corner of the Tool models workspace, click Add.
In the Add Tool model dialog box, configure the Tool model parameters.
On the upper-right corner of the Add Tool model dialog box, click Save.
Editing a Tool model
On the upper-right corner of the Tool model details card, click Edit.
In the Edit Tool model dialog box, make the necessary changes.
If the Tool model to edit is a Wrench defined in the ISO 6789 standards:
On the upper-right corner of the Edit Tool model dialog box, click on Load ISO 6789 parameters.
In the ISO 6789 parameters dialog box, click on the switches to select/deselect the parameters.
In the ISO 6789 parameters table, deselect the inspection results to be removed from calculations.
On the upper-right corner of the ISO 6789 parameters dialog box, click on Apply.
On the upper-right corner of the Edit Tool model dialog box, click Save.
Tool model parameters
Tool image: upload the image of the tool model.
Name (*): type the name of the tool model.
Manufacturer (*): add/select the manufacturer of the tool model.
Do one of the following:
Click Add icon (
) to add a new manufacturer. In the Add Manufacturer dialog box, enter the details related to new manufacturer.
Then, click Save.
In the Manufacturer drop-down list, select the manufacturer of the tool model.
Part code: type the part code of the tool model.
Catalogue Url: type the link to the online catalogue.
Type (*): in the Type drop-down list, select the type of the tool.
If Type is set to Generic, all the other items listed below are not available. It is possible only to add Notes.
Category (*): in the Category drop-down list, select the category of the tool model.
Category drop-down list is available only after selecting the type of the tool.
Operating principle (*): in the Operating principle drop-down list, select the operating principle of the tool model (Continuous, Pulse, and Stroke).
Operating principle drop-down list is available only after selecting either Screwdriver or Nutrunner as Type.
Control system: in the Control system drop-down list, select the control system of the tool model.
Control system drop-down list is available only after selecting either Screwdriver or Nutrunner as Type.
Max speed: type the max speed of the tool model (in rpm).
Max Speed is available only after selecting Screwdriver or Nutrunner as Type.
Max working pressure: type the max working pressure of the tool model (in bar or psi).
Max working pressure is available only after selecting Pneumatic Assembly Tools as Category.
Torque correction coefficient: type the torque correction coefficient of the tool model.
Torque correction coefficient is available only after selecting Pulse or Stroke as operating principle.
Measurement unit: select the measurement unit to define the torque parameters of the tool model. The default measurement unit is defined both in the Application settings and in the Personal settings.
Torque range
Min (*): type the minimum torque value of the tool model.
Max (*): type the maximum torque value of the tool model.
Square drive size: in the Square drive size drop-down list, select the square drive size of the tool model. This parameters is not displayed if Type is set to Wrench.
ISO 6789
This section is displayed if the Type is set to Wrench.
ISO 6789 type (*): in the ISO 6789 type drop-down list, select the type of wrench defined in the ISO 6789.
ISO 6789 type drop-down list is available only after selecting Wrench as Type and Hand-operated tools as Category.
ISO 6789 class (*): in the ISO 6789 class drop-down list, select the class of wrench defined in the ISO 6789. The items depend on the ISO 6789 type selected.
ISO 6789:2017
Click type (*): select the click type. The options are: Click and Cam-over.
Click type drop-down list is available only after selecting Setting torque tools as ISO 6789 type.
Resolution (r): type the resolution value.
The resolution field is available for all classes of ISO 6789 type I, and for class A, D and G of ISO 6789 type II.
Tightening Direction: enter the following values for tool models operating in Clockwise, Counterclockwise, or in both directions:
brep: type the value of the variation due to the reproducibility.
bod: type the variation due to the geometric effect of the output drive of the torque tool.
bint: type the value of the variation due to the interface between the output drive and the calibration system.
bl: type the value of the variation of the force loading point.
ToolsNet open protocol: enable this option if the tools defined with this model are connected directly to the ToolsNet 8 through the Data Communication Service module using the TNOP port 9014.
For further information, see ToolsNet 8 User Guide.
Notes: if necessary, type a note.
Items marked with an asterisk (*) are required.
If the Tool model is linked to an inspection, the following parameters cannot be modified: Type, Category, Operating principle, Control system, ISO 6789 type, ISO 6789 class.
Setting the Tool model filters
On the left-side menu bar, click Main data > Tool models.
On the upper-right corner of the Tool models workspace, click Filter.
In the Tool models filter dialog box, set the tool model filter criteria (depending on the customer needs):
On the upper-right corner of the Tool models filter dialog box, click Apply.
Tool model filter criteria
Name: type the name of the tool model to be filtered.
Manufacturer: in the drop-down list, select the manufacturer (of the tool model) to be filtered.
Type: in the drop-down list, select the type (of the tool model) to be filtered.
Category: in the drop-down list, select the category (of the tool model) to be filtered.
Operating principle: in the drop-down list, select the operating principle (of the tool model) to be filtered.
Control system: in the drop-down list, select the control system (of the tool model) to be filtered.
Status: in the drop-down list, select the status (of the tool model) to be filtered.
Selected filter: from the drop-down list, select one of the saved customized filter.
For more information on how to manage customized filters, refer to Filters customization.
Exporting data
On the upper-right corner of the page, click Export.
An Excel file is created with all the configured data.
If some filters are applied to the list, only the filtered items are exported.
All the saved information are exported, except the pictures.
Importing data
On the upper-right corner of the page, click Export. An Excel file is created.
If the page is empty, the export file is created with all the fields empty.
Save the Excel file created by the application.
Open the Excel file and add/edit the items of interest following the rules listed at the end of the procedure.
Save the edited file.
On the upper-right corner of the page, click Import. Then select the file to import from the upload window and click Open.
If some errors occurred during the import, a yellow message is displayed and an Excel file with all the not imported rows is created.
The description on the error occurred for each rows is displayed at the last columns on the right of the Excel file.
Open the excel file with the list of error and correct them following the rules listed below.
Save the edit file.
On the upper-right corner of the page, click Import. Then select the file to import from the upload window and click Open.
Repeat the step from 7 to 9 until all the errors are corrected.
The “Internal ID” column determines if the data is new or an update of existing ones. If set to empty, it is new data, if left with exported value, it is an update.
To edit the export file:
Do not delete or edit the header of the columns.
Do not change the order of the columns of the exported file.
Do not add other sheet to the exported file.
Do not change the name of the sheet of the exported file.
Do not change the file format.
To delete an entire row of the exported file: select the row, right-click it and select Delete.
It is allowed to change the file name.
The columns of the exported file are independent. If a unit of measurement is changed, the related numerical value is not converted.
Controller models
On the left-side menu bar, click Main Data > Controller models.
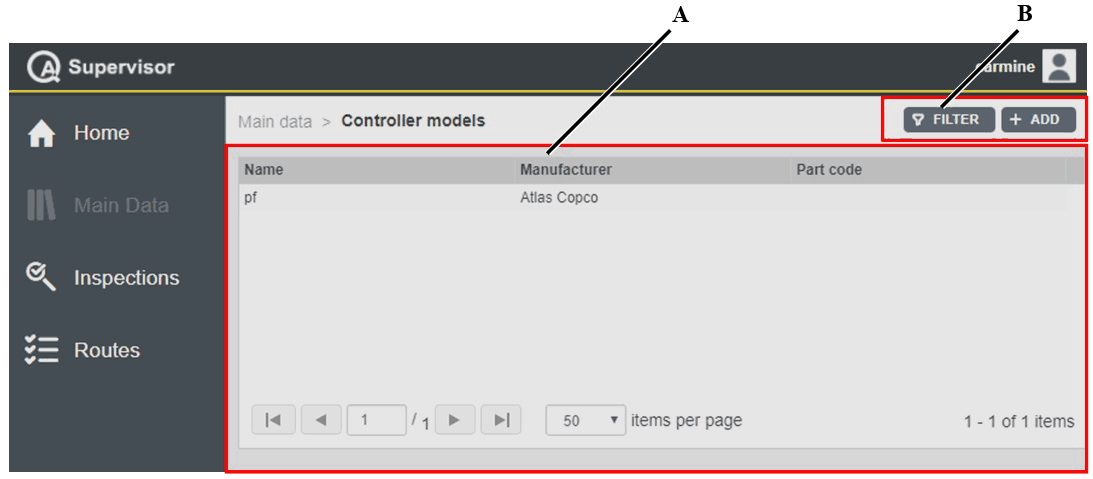
A | Controller models workspace | B | Command buttons |
The Controller models workspace is divided into the following columns:
Name: name of the controller model.
Manufacturer: name of the manufacturer of the controller model.
Part code: part code of the controller model.
In the Controller models workspace, click a controller model to display the related Controller Model Details card.
On the upper-right corner of the Controller Model Details card, click the Close button to exit the Controller Model Details card.
On the upper-right corner of the Controller models workspace, there are the following command buttons:
Add: click to add a new controller model into the Controller models workspace.
Filter: click to give filters and list only the necessary controller model(s).
Adding a controller model
On the left-side menu bar, click Main Data > Controller models.
On the upper-right corner of the Controller models workspace, click Add.
In the Add Controller Model dialog box, configure the controller model parameters.
On the upper-right corner of the Add Controller Model dialog box, click Save.
Editing a Controller Model Details card
On the upper-right corner of the Controller Model Details card, click Edit.
In the Edit Controller Model dialog box, make the necessary changes.
On the upper-right corner of the Edit Controller Model dialog box, click Save.
Controller model parameters
Controller image: upload the image of the controller model.
Name (*): type the name of the controller model.
Manufacturer (*): add/select the manufacturer of the controller model.
Do one of the following:
Click Add icon (
) to add a new manufacturer. In the Add Manufacturer dialog box, enter the details related to new manufacturer.
Then, click Save.
In the Manufacturer drop-down list, select the manufacturer of the controller model.
Part code: type the part code of the controller model.
Notes: if necessary, type a note.
Items marked with an asterisk (*) are required.
Setting the controller model filter
On the left-side menu bar, click Main Data > Controller models.
On the upper-right corner of the Controller models workspace, click Filter.
In the Controller Unit Models Filter dialog box, set the controller model filter criteria (depending on the customer needs).
On the upper-right corner of the Controller Unit Models Filter dialog box, click Apply.
Controller model filter criteria
Name: type the name of the controller model to be filtered.
Manufacturer: in the drop-down list, select the manufacturer (of the controller model) to be filtered.
Part code: type the part code of the controller model to be filtered.
Status: in the drop-down list, select the status (of the controller model) to be filtered.
Selected filter: from the drop-down list, select one of the saved customized filter.
For more information on how to manage customized filters, refer to Filters customization.
Manufacturers
On the left-side menu bar, click Main Data > Manufacturers.
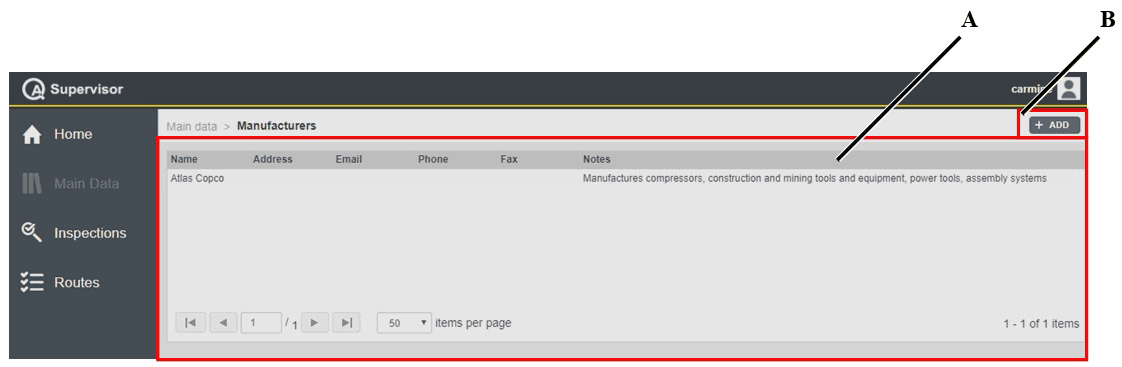
A | Manufacturers workspace | B | Command button |
The Manufacturers workspace is divided into the following columns:
Name: name of the manufacturer.
Address: address of the manufacturer.
E-mail: e-mail of the manufacturer.
Phone: phone of the manufacturer.
Fax: fax of the manufacturer.
Notes: notes related to the manufacturer.
In the Manufacturers workspace, click a manufacturer to display the related Manufacturer Details card.
On the upper-right corner of the Manufacturer Details card, click the Close button to exit the Manufacturer Details card (without saving any change).
On the upper-right corner of the Manufacturer models workspace, there is the following command button:
Add: click to add a new manufacturer into the Manufacturer workspace.
Adding a manufacturer
On the left-side menu bar, click Main Data > Manufacturer.
On the upper-right corner of the Manufacturer workspace, click Add.
In the Add Manufacturer dialog box, configure the manufacturer parameters.
On the upper-right corner of the Add Manufacturer dialog box, click Save.
Editing a Manufacturer Details card
On the upper-right corner of the Manufacturer Details card, click Edit.
In the Edit Manufacturer dialog box, make the necessary changes.
On the upper-right corner of the Edit Manufacturer dialog box, click Save.
Manufacturer parameters
Name (*): type the name of the manufacturer.
Address: type the address of the manufacturer.
E-mail: type the e-mail address of the manufacturer.
Phone: type the phone number of the manufacturer.
Fax: type the fax of the manufacturer.
Notes: if necessary, type a note.
Items marked with an asterisk (*) are required.
Deleting a Manufacturer Details card
On the upper-right corner of the Manufacturer Details card, click Delete.
Suppliers
On the left-side menu bar, click Main Data > Suppliers.
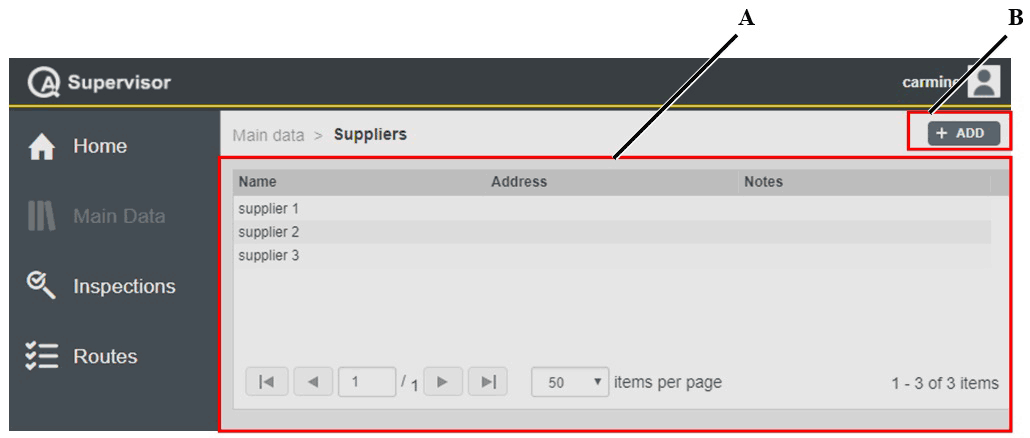
A | Suppliers workspace | B | Command buttons |
The Suppliers workspace is divided into the following columns:
Name: name of the supplier.
Address: address of the supplier.
Notes: notes related to the supplier.
In the Suppliers workspace, click a supplier to display the related Supplier Details card.
On the upper-right corner of the Supplier Details card, click the Close button to exit the Supplier Details card.
On the upper-right corner of the Suppliers workspace, there is the following command button:
Add: click to add a new supplier into the Supplier workspace.
Adding a supplier
On the left-side menu bar, click Main Data > Supplier.
On the upper-right corner of the Supplier workspace, click Add.
In the Add Supplier dialog box, configure the supplier parameters.
On the upper-right corner of the Add Supplier dialog box, click Save.
Editing a Supplier Details card
On the upper-right corner of the Supplier Details card, click Edit.
In the Edit Supplier dialog box, make the necessary changes.
On the upper-right corner of the Edit Supplier dialog box, click Save.
Supplier parameters
Name (*): type the name of the manufacturer.
Notes: if necessary, type a note.
Contacts: in the Contacts box, select the necessary contact.
To add a new contact, click Add icon (
).In the Add Supplier Contact dialog box, enter the necessary details related to new contact.
Then, click Save.
To edit a contact already configured, in the Contacts box, select it.
Click Edit icon (
 ).
).In the Edit Supplier Contact dialog box, edit the contact.
Then, click Save.
To delete a contact already configured, in the Contact box, select it.
Then, click Delete icon (
).
Items marked with an asterisk (*) are required.
Deleting a Supplier Details card
On the upper-right corner of the Supplier Details card, click Delete.
Binary option
On the left-side menu bar, click Main Data > Binary option.
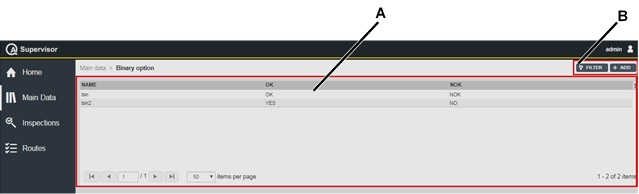
A | Binary option workspace | B | Command buttons |
The Binary option workspace is divided into the following columns:
Name: name of the binary option variable.
OK: positive option of the binary variable.
NOK: negative option of the binary variable.
In the Binary option workspace, click a binary option to display the related Binary option card.
On the upper-right corner of the Binary option card, click the Close button to exit the Binary option card (without saving any change).
At the end of the Binary option card, the following items record all of the changes made for the selected measuring device:
Version: version of the binary option configuration.
In the Edit binary option dialog box, change at least an option to make a new version.
Changed by: name of the operator who has made a change to the binary option configuration.
History: the history table records all changes made for the selected binary option.
The first line of the history table summarizes the latest version of the binary option configuration. Click a previous line: the related Binary option details card opens on the left of the Binary option details card related to the latest version. The differences between the two Binary option details cards are yellow highlighted.
On the upper-right corner of the oldest Binary option details card, click Restore: the previous version of the measuring device configuration becomes the latest one.
On the upper-right corner of the Binary option workspace, there are the following command buttons:
Add: click to add a new binary option into the Binary option page.
Filter: click to give filters and list only the necessary binary option(s).
Adding a binary option
On the left-side menu bar, click Main Data > Binary option.
On the upper-right corner of the Binary option workspace, click Add.
In the Add binary option dialog box, configure the binary option parameters.
On the upper-right corner of the Add binary option dialog box, click Save.
Editing a binary option
On the upper-right corner of the Binary option details card, click Edit.
In the Edit binary option dialog box, make the necessary changes.
On the upper-right corner of the Edit binary option dialog box, click Save.
Binary option parameters
Name (*): type the name of the binary option.
Entries
OK (*): type the positive option of the binary variable.
NOK (*): type the negative option of the binary variable.
Items marked with an asterisk (*) are required.
Cloning a binary option
On the upper-right corner of the Binary option details card, click Clone.
The Add binary option dialog box automatically opens with all the items configured as in the Binary option details card cloned.
If necessary, in the Add binary option dialog box, make the necessary changes.
On the upper-right corner of the Add binary option dialog box, click Save.
Setting the binary option filter
On the left-side menu bar, click Main Data > Binary option.
On the upper-right corner of the Binary option workspace, click Filter.
In the Binary option filter dialog box, set the binary option filter criteria (depending on the customer needs):
On the upper-right corner of the Binary option filter dialog box, click Apply.
Binary option filter criteria
Name: type the name of the binary option to be filtered.
Status: select one of the following options, depending on the status of the binary options to filter:
Enabled: only the enabled binary options are filtered.
Disabled: only the disabled binary options are filtered.
Both: all the binary options (Enabled and Disabled) are filtered.
Selected filter: from the drop-down list, select one of the saved customized filter.
For more information on how to manage customized filters, refer to Filters customization.
Attribute list
On the left-side menu bar, click Main Data > Attribute list.
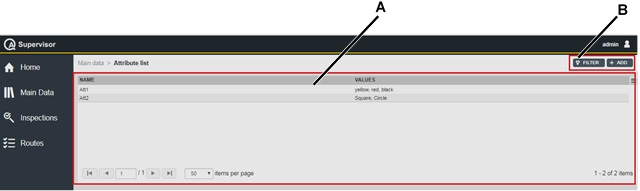
A | Attribute list workspace | B | Command buttons |
The Attribute list workspace is divided into the following columns:
Name: name of the attribute list.
Values: values configured in the attribute list.
In the Attribute list workspace, click an attribute list to display the related Attribute list card.
On the upper-right corner of the Attribute list card, click the Close button to exit the Attribute list card (without saving any change).
At the end of the Attribute list card, the following items record all of the changes made for the selected measuring device:
Version: version of the attribute list configuration.
In the Edit attribute list dialog box, change at least a value configured in the attribute list to make a new version.
Changed by: name of the operator who has made a change to the attribute list configuration.
History: the history table records all changes made for the selected attribute list.
The first line of the history table summarizes the latest version of the attribute list configuration. Click a previous line: the related Attribute list details card opens on the left of the Attribute list details card related to the latest version. The differences between the two Attribute list details cards are yellow highlighted.
On the upper-right corner of the oldest Attribute list details card, click Restore: the previous version of the measuring device configuration becomes the latest one.
On the upper-right corner of the Attribute list option workspace, there are the following command buttons:
Add: click to add a new attribute list into the Attribute list page.
Filter: click to give filters and list only the necessary attribute list(s).
Adding an attribute list
On the left-side menu bar, click Main Data > Attribute list.
On the upper-right corner of the Attribute list workspace, click Add.
In the Add attribute list dialog box, configure the attribute list parameters.
On the upper-right corner of the Add attribute list dialog box, click Save.
Editing an attribute list
On the upper-right corner of the Attribute list details card, click Edit.
In the Edit attribute list dialog box, make the necessary changes.
On the upper-right corner of the Edit attribute list dialog box, click Save.
Attribute list parameters
Name (*): type the name of the attribute list.
Values: near the Values box, click the Add icon (
).In the Values box, double-click the new row. Type the new value and then click outside the Values box.
To edit a value already configured, in the Values box, double-click it. Then edit the value.
To delete a value previously configured, select the value and then click Delete icon (
).To change the sorting of the values in the Values box, click the Move up icon (
 ) or the Move down icon (
 ).
).Allow manual input: click the allow manual input switch to enable the possibility to add manually a value during the test. This value is saved only for the inspection, it is not added to the attribute list.
Items marked with an asterisk (*) are required.
Cloning an attribute list
On the upper-right corner of the Attribute list details card, click Clone.
The Add attribute list dialog box automatically opens with all the items configured as in the Attribute list details card cloned.
If necessary, in the Add attribute list dialog box, make the necessary changes.
On the upper-right corner of the Add attribute list dialog box, click Save.
Setting the attribute list filter
On the left-side menu bar, click Main Data > Attribute list.
On the upper-right corner of the Attribute list workspace, click Filter.
In the Attribute list filter dialog box, set the attribute list filter criteria (depending on the customer needs):
On the upper-right corner of the Attribute list filter dialog box, click Apply.
Attribute list filter criteria
Name: type the name of the binary option to be filtered.
Status: select one of the following options, depending on the status of the attribute list to filter:
Enabled: only the enabled attribute lists are filtered.
Disabled: only the disabled attribute lists are filtered.
Both: all the attribute lists (Enabled and Disabled) are filtered.
Selected filter: from the drop-down list, select one of the saved customized filter.
For more information on how to manage customized filters, refer to Filters customization.
Selectables
On the left-side menu bar, click Main Data > Selectables.
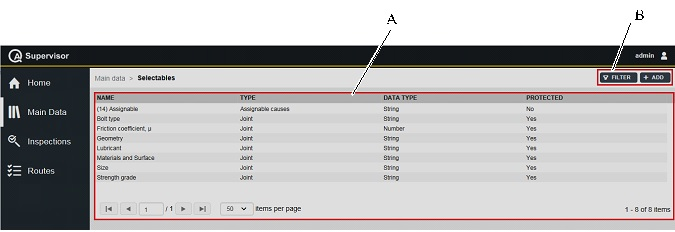
A | Selectables workspace | B | Command buttons |
The Selectables workspace is divided into the following columns:
Name: name of the selectable.
Type: type of the selectable.
Data type: type of the selectable value. The available type are number and string.
Protected: if Protected = Yes, the selectable is a default value and it is not possible to disable it.
If Protected = No, the selectables has been configured by the user and it is possible to disable it.
In the Selectables workspace, click a selectable to display the related Selectable details card.
On the upper-right corner of the Selectable details card, click the Close button to exit the Selectable details card.
At the end of the Selectable details card, the following items record all of the changes made for the selected selectable:
Version: version of the selectable configuration.
In the Edit Selectable dialog box, change one of the following items to make a new version: Type, Data type, Values
Changed by: name of the operator who has made a change to the selectable configuration.
History: the history table records all of the changes made for the selected selectable.
The first line of the history table summarizes the latest version of the selectable configuration.
Click a previous line: the related Selectable details card opens on the left of the Selectable details card related to the latest version.
The differences between the two Selectable details cards are yellow highlighted.
On the upper-right corner of the oldest Selectable details card, click Restore: the previous version of the selectable configuration becomes the latest one.
On the upper-right corner of the Selectables workspace, there is the following command button:
Add: click to add a new supplier into the Selectables workspace.
Filter: click to give filters and list only the necessary selectable(s).
Adding a selectable
On the left-side menu bar, click Main data > Selectables.
On the upper-right corner of the Selectables workspace, click Add.
In the Add selectable dialog box, configure the selectable parameters.
On the upper-right corner of the Add selectable dialog box, click Save.
Editing a Selectable details card
On the upper-right corner of the Selectable details card, click Edit.
In the Edit selectable dialog box, make the necessary changes.
On the upper-right corner of the Edit selectable dialog box, click Save.
Selectable parameters
Name (*): type the name of the selectable.
Type (*): in the Type drop down list, select the type of the selectable. The available types are: Corrective actions, Assignable causes, Traceability tags, Physical quantities and Custom fields.
Data type (*): in the Data type drop down list, select the type of the selectable value to configure. The available data types are: Number and String.
Value: near the Values box, click the Add icon (
).In the Values box, double-click the new row. Type the new value and then click outside the Values box.
To edit a value already configured, in the Values box, double-click it. Then edit the value.
To delete a value previously configured, select the value and then click Delete icon (
).To change the sorting of the values in the Values box, click the Move up icon (
) or the Move down icon ().
Items marked with an asterisk (*) are required.
Defining the properties of the bolt
The Selectables that define the bolt properties are the following: bolt type, friction coefficient, geometry, lubricant, material and surface, size, and strength grade.
All these selectables are protected.
On the left-side menu bar, click Main Data > Selectable.
In the Selectables page, select a Joint type selectable from the table.
On the upper-right corner of the Selectable details dialog box, click Edit.
In the Edit selectable dialog box, add/delete/move an item of the Value box.
To add a value, near the Values box, click the Add icon (
).In the Values box, double-click the new row. Type the new value and then click outside the Values box.
To edit a value already configured, in the Values box, double-click it. Then edit the value.
To delete a value previously configured, select the value and then click Delete icon (
).To change the sorting of the values in the Values box, click the Move up icon (
) or the Move down icon ().All the other parameters of the Edit selectable dialog box are unavailable.
On the upper-right corner of the Edit selectable dialog box, click Save.
Setting the selectables filter
On the left-side menu bar, click Main data > Selectables.
On the upper-right corner of the Selectables workspace, click Filter.
In the Selectables filter dialog box, set the selectables filter criteria (depending on the customer needs).
On the upper-right corner of the Selectables filter dialog box, click Apply.
Selectables filter criteria
Name: type the name of the selectable to be filtered.
Type: in the Type drop-down list, select the selectable type to be filtered.
Data type: in the Data type drop-down list, select the data type to be filtered.
Status: in the Status drop-down list, select the status of the selectable to be filtered.
Selected filter: from the drop-down list, select one of the saved customized filter.
For more information on how to manage customized filters, refer to Filters customization.
Users
On the left-side menu bar, click Main Data > Users.
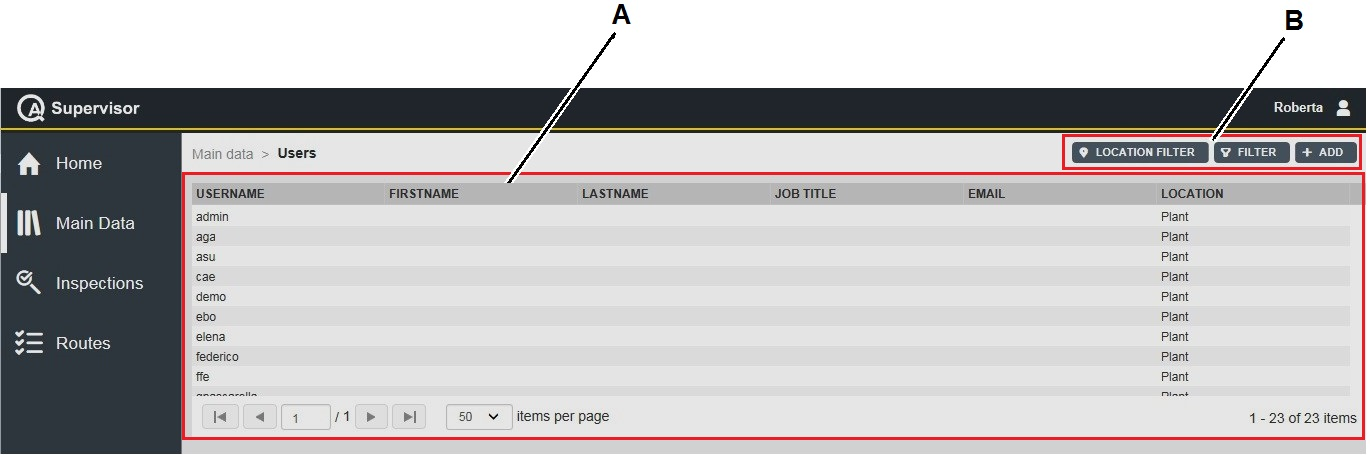
A | Users workspace | B | Command buttons |
The Users workspace is divided into the following columns:
User name: user name of the user.
First name: first name of the user.
Last name: last name of the user.
Job title: job title of the user
E-mail: e-mail of the user.
Location: area of the plant where the user gets access.
Last login date: date of the last login of the user.
In the Users workspace, click a user to display the related User Details card.
On the upper-right corner of the User Details card, click the Close button to exit the User Details card (without saving any change).
On the upper-right corner of the Users workspace, there are the following command buttons:
Add: click to add a new tool into the Users workspace.
Filter: click to give filters and list only the necessary user(s).
Location Filter: click to filter the user(s) depending on its location in the factory structure.
Adding a user
On the left-side menu bar, click Main Data > Users.
On the upper-right corner of the Users workspace, click Add.
In the Add User dialog box, configure the user parameters.
On the upper-right corner of the Add User dialog box, click Save.
Editing a User Details card
On the upper-right corner of the User Details card, click Edit.
In the Edit User dialog box, make the necessary changes.
On the upper-right corner of the Edit User dialog box, click Save.
User parameters
Username (*): type the user name of the user.
Password (*): type the password for the new user.
For more information about the password rules, see "Changing the password".
Confirm password: confirm the password for the new user.
Location (*): select the area of the plant where using the user gets access.
Do as follows:
Click Location icon (
).In the Location dialog box, select the area of the plant where the user gets access.
Then, click Apply.
Role: add/select the user role, that defines the rights the user has in the application.
Do one of the following:
Select one of the already configured roles in the Role drop down list.
Click Add icon (
). In the Add role dialog box, enter the details related to the new role. Then click Save.
First name: type the first name of the user.
Last name: type the last name of the user.
Job title: type the job title of the user.
User picture: Upload the picture of the user.
Company Contacts
E-mail: type the e-mail address of the company.
Mobile: type the mobile number of the company.
Phone: type the phone number of the company.
Items marked with an asterisk (*) are required.
Setting the user filter
On the left-side menu bar, click Main Data > Users.
On the upper-right corner of the Users workspace, click Filter.
In the Users Filter dialog box, set the user filter criteria (depending on the customer needs).
On the upper-right corner of the Users Filter dialog box, click Apply.
User filter criteria
Username: type the name of the user to be filtered.
First name: type the first name of the user to be filtered.
Last name: type the last name of the user to be filtered.
Status: in the drop-down list, select the status (of the user) to be filtered.
Selected filter: from the drop-down list, select one of the saved customized filter.
For more information on how to manage customized filters, refer to Filters customization.
Roles
On the left-side menu bar, click Main Data > Roles.
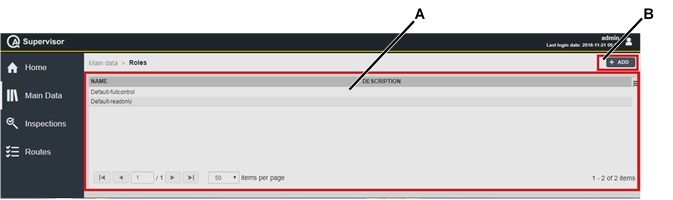
A | Roles workspace | B | Command button |
The Roles workspace is divided into the following columns:
Name: name of the role.
Description: brief description of the role.
In the Roles workspace, click a role to display the related Role Details card.
On the upper-right corner of the Roles Details card, click the Close button to exit the Role Details card (without saving any change).
Two roles are displayed by default:
Default-full control: the user linked to this role can do every action in the application.
Default readonly: the user linked to this role can only read the information stored.
It is not possible to edit/clone/delete these two roles.
On the upper-right corner of the Roles workspace, there are the following command buttons:
Add: click to add a new role into the Roles workspace.
Adding a role
On the left-side menu bar, click Main Data > Roles.
On the upper-right corner of the Roles workspace, click Add.
In the Add Role dialog box, enter the following items:
Name (*): type the name of the Role.
Description: type the description of the new Role.
In the Main data / Inspections / Routes / Data import and export / QASupervisor API sections of the Add Role dialog box , enable the actions the user can do.
On the upper-right corner of the Add Role dialog box, click Save.
Items marked with an asterisk (*) are required.
Editing a Role
On the upper-right corner of the Role Details card, click Edit.
In the Edit Role dialog box, make the necessary changes.
On the upper-right corner of the Edit Role dialog box, click Save.
Cloning a Role Details card
On the upper-right corner of the Role Details card, click Clone.
The Add Role card automatically opens with all the items configured as in the Role Details card cloned.
If necessary, in the Add Role card, make the necessary changes.
On the upper-right corner of the Add Role card, click Save.
Deleting a Role
On the upper-right corner of the Role Details card, click Delete.
It is possible to delete a role only if it is not linked to any user.
Factory structure
On the left-side menu bar, click Main Data > Factory structure.
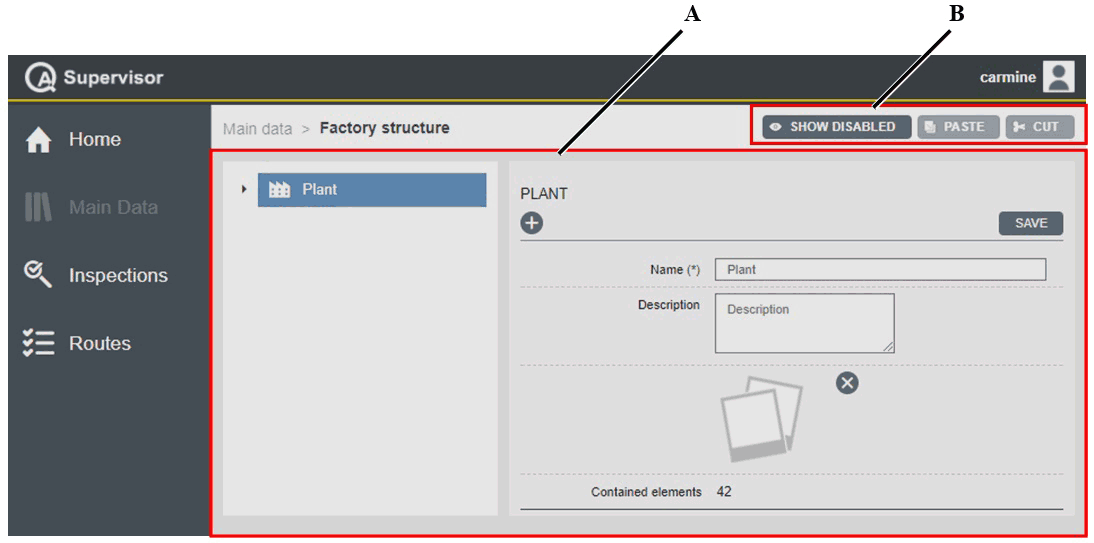
A | Factory structure workspace | B | Command buttons |
On the left side of the Factory structure workspace, the tree view shows the hierarchical structure of the plant. Click the arrow on the left of the element of the factory structure to show the related sub-element(s).
On the right side of the Factory structure workspace, the configuration card for all of the elements of the plant is displayed. The standard plant has the following elements:
Building: part of the plant where the lines are placed.
Line: set of sequential operations established whereby components are assembled to make a finished article.
Station: area where a single operation is done. The station can be in line and offline.
Assembly part: composite part of the final product made by more than one basic parts.
Toolcrib: area where tools are repaired, inventoried, and/or distributed for use within the factory.
At the end of the configuration card, Contained elements line shows how many elements (Users, Tools, Controller units, Measuring devices, Transducers, and Joints) are configured within the plant.
After selecting an element of the plant, on the upper-left corner of the related configuration card, the following command buttons are displayed:
- : click to add a new sub-element within the selected one.
Add Building, Line, Toolcrib, and Station as sub-elements in the Buildings and Lines.
Add Assembly Part as sub-elements in the Station.
- : click to move up the sub-element within the node it belongs to.
When the sub-element gets the top of the node it belongs to, the button appears dimmed and it is unavailable.
- : click to move down the sub-element within the node it belongs to.
When the sub-element gets the bottom of the node it belongs to, the button appears dimmed and it is unavailable.
 : click to disable the selected sub-element.
 When disabled, the sub-element is neither editable nor shown in the Factory structure.
When disabled, on the upper-right corner of the configuration card of the selected sub-element, Delete button is displayed. Click Delete to delete the disabled selected sub-element.
The sub-elements cannot be disabled if they contain active elements (Users, Tools, Control units, Measuring devices, Transducers, and Joints).
On the upper-right corner of the Factory structure workspace, there are the following command buttons:
Show Disabled: click to display the hidden sub-elements of the plant.
Paste: click to paste a sub-element previously cut.
Before cutting a sub-element of the plant, Paste appears dimmed and it is unavailable.
After cutting a sub-element of the plant, Paste is available.
Cut: click to cut a sub-element of the plant.
After cutting a sub-element of the plant, Cut appears dimmed and it is unavailable.
Before cutting a sub-element of the plant, Cut is available.
Adding a new element within the Plant
On the upper-left corner of the configuration card, click
and select the new element (Building, Line, Toolcrib, and Station) to be added within the plant.In the Name box of the configuration card, type the name of the new element.
In the Description box of the configuration card, type the description of the new element.
Under the Description box, click
 to upload a picture of the new element.
On the upper-right corner of the configuration card, click Save.
Editing an element within the Plant
On the left side of the Factory structure workspace, click the arrow on the left of Plant to show the related hierarchical structure.
Then, select the element to be edited.
On the right side of the Factory structure workspace, the configuration card of the selected element is displayed.
In the configuration card of the selected element, make the necessary changes.
On the upper-right corner of the configuration card of the selected element, click Save.
Inspections menu
On the left-side menu bar, click Inspections to configure the following items:
Results
Definitions
Working calendars
Scheduling
Multisteps
Traces
Results
On the left-side menu bar, click Inspections > Results.
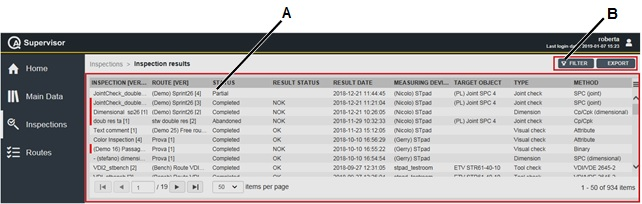
A | Inspection results workspace | B | Command button |
The Inspection Results workspace is divided into the following columns:
Inspection [Ver]: name and version of the inspection.
Route [Ver]: name and version of the route linked to the inspection.
Status: below are the available options, depending on the status of the inspection:
Partial: the inspection is closed before the batch is completed. The test can be completed later on.
Completed: the inspection execution is closed after the batch is completed.
Abandoned: the inspection execution is not completed but it is manually closed. The test cannot be completed later on.
Result status: below are the available options, depending on the result status of the inspection:
OK: all the results are OK.
NOK: at least one result is NOK.
Result date: date of the inspection execution.
Measuring device: measuring device used to do the inspection.
Target object: name of the tool/joint/assembly part under control.
Type: type of the inspection.
The Quality Inspections defined in QA Supervisor have type Production when the Tool cycle counter threshold is reached and/or the production SPC on the tool configured in the Quality inspection is failed.
In the Inspection result details card, the data loaded from ToolsNet8 are displayed. For the production SPC, at most the last seven average values are shown.
The Results status of these inspections is always NOK
Method: method of the inspection.
In the Inspection Results workspace, click an inspection to display the related Inspection Result Details card.
On the upper-right of the Inspection Result Details card, there are the following command buttons:
Close: click to close the Inspection Result Details card.
Data: click to open the Measurement Details card.
The Measurement Details card depends on the method selected.
Report: click to make a report with the configuration and all the results of the selected execution.
The default report format is defined in the Application settings and in the Personal settings.
Report button is displayed only if the execution is completed.
On the upper-right corner of the Inspection Results workspace, there is the following command button:
Export: click to export all the results save on the database of the application.
Filter: click to give filters and list only the necessary results.
The Export button is available only if the roles for exporting results are enabled. Refer to the Roles paragraph for more information.
Inspection result details card
In this card, the Data related to the inspection configuration and the main results are shown.
Clicking the underlined items (for example, Inspection, Route, Measuring device), the related configuration card opens.
If the Measuring device details card of STpad, STbench and STpalm is open, the firmware version used during the test is shown.
All the STbench/STpad versions previous the 1.2a are indicated as 1.2a
Cm/Cmk
Below are the items of the Cm/Cmk inspection result details card:
Inspection: name of the inspection.
Route: name of the route linked to the inspection.
Result date: date of the inspection.
Measuring device: measuring device used to do the inspection.
Target object: name of the tool under control.
Operator: name of the operator that did the inspection.
It is shown if the measuring device manages the users.
Status: below are the available options, depending on the status of the inspection:
Partial: the inspection is closed before the batch is completed. The test can be completed later on.
Completed: the inspection execution is closed after the batch is completed.
Abandoned: the inspection execution is not completed but it is manually closed. The test cannot be completed later on.
Results status: below are the available options, depending on the result status of the inspection:
OK: all the results are OK.
NOK: at least one result is NOK.
Table with step status: table with the result status of each step of a multistep target source.
This item is shown only if multistep is the target source.
Control Chart
Torque/angle: for Cm/Cmk inspection, the graphs of the measured points of the functions under control are displayed.
The function under control can be torque, angle or both.
In the graphs, the lines indicate:
the upper and lower limits (red lines)
the target values (green line)
target value +/- 3σ (blue lines) (σ is the standard deviation)
Click the chart to open a full screen graph.
For multistep target source, the graphs of the last step are displayed. Select a row of the table with step status, to display the points related to the selected step.
Statistics
Torque/Angle: below are the statistics of torque, angle or both:
Minimum Cm and Cmk
Current Cm and Cmk
Average value
σ: standard deviation
Average values +/- 3σ
6Sigma scatter % of mean torque: single numeric value designating the torque capability of a tool run on a single torque-rate joint under controlled conditions
This parameter is available only for Torque section.
For multistep target source, the statistics of the last step are displayed. Select a row of the table with step status, to display the statistics related to the selected step.
Traceability: in this table the traceability tags configured in the route linked to the inspection are shown. In particular, the name, the level and the values of each configured traceability tag are displayed.
SPC (tool)
Below are the items of the SPC (tool) inspection result details card:
Inspection: name of the inspection.
Route: name of the route linked to the inspection.
Result date: date of the inspection.
Measuring device: measuring device used to do the inspection.
Target object: name of the tool under control.
Operator: Name of the operator that did the inspection.
It is shown if the measuring device manages the users.
Status: below are the available options, depending on the status of the inspection:
Partial: the inspection is closed before the batch is completed. The test can be completed later on.
Completed: the inspection is closed after the batch is completed.
Abandoned: the inspection is not completed but it is manually closed. The test cannot be completed later on.
Results status: below are the available options, depending on the result status of the inspection:
OK: all the results of the completed subgroup or completed batch are OK.
NOK: at least one result of the completed subgroup or completed batch is NOK.
No status: if the ongoing subgroup is not completed, the status of the batch cannot be evaluated and is left blank.
X/R Chart
X chart: chart of the average values. The last point is the average of the last subgroup. The previous points are the average values of the subgroups done before.
In the graphs, the lines indicate:
the upper and lower limits (red lines)
the target values (green line)
target value +/- 3σ (blue lines) (σ is the standard deviation)
Click the chart to open a full screen graph.
R chart: chart of the range (maximum measured values - minimum measured values).
The last point is the range of the last execution. The previous points are the range values of the execution done before.
In the graphs, the lines indicate:
the upper and lower limits (red lines)
the target values (green line)
target value +/- 3σ (blue lines) (σ is the standard deviation)
Click the chart to open a full screen graph.
SPC Rules
List of the rules applied with the result (OK/NOK/NA) per each rule.
Traceability: in this table the traceability tags configured in the route linked to the inspection are shown. In particular, the name, the level and the values of each configured traceability tag are displayed.
ISO 5393
Below are the items of the ISO 5393 inspection result details card:
Inspection: name of the inspection.
Route: name of the route linked to the inspection.
Result date: date of the inspection.
Measuring device: measuring device used to do the inspection.
Target object: name of the tool under control.
Operator: Name of the operator that did the inspection.
It is shown if the measuring device manages the users.
Status: below are the available options, depending on the status of the inspection:
Partial: the inspection is closed before the batch is completed. The test can be completed later on.
Completed: the inspection execution is closed after the batch is completed.
Abandoned: the inspection execution is not completed but it is manually closed. The test cannot be completed later on.
Tool torque scatter capability: max value between the Combined torque scatter % combined mean torque of the upper and lower test torque levels.
Upper/Lower Test Torque Level: High/Low Torque Rate
Mean torque: mean value according to ISO standard.
Range: range value according to ISO standard.
Standard deviation: measure of the dispersion based on the mean-squared deviation, according to ISO standard.
6 Sigma torque scatter: predictable range of torque over which a tool runs through a single torque-rate joint under controlled conditions, according to ISO standard.
6 Sigma scatter % of the mean torque: single numeric value designating the torque capability of a tool run on a single torque-rate joint under controlled conditions.
Upper/Lower Test Torque Level: High and Low Torque Rate
Mean torque combined: midpoint of the combined torque scatter of a tool between the lowest and the highest predictable torque readings, according to ISO standard.
Mean shift: difference in mean torque of a tool run on a threaded joints of two different torque rates at the same setting of the tool torque adjustment, according to ISO standard.
Combined torque scatter: total probable range of torque of a tool run on all joints used in practice at the same setting of the tool torque adjustment, according to ISO standard.
Combined torque scatter % combined mean torque: single numerical value designating the torque capability of a tool run on joints of varying torque rate, according to ISO standard.
Traceability: in this table the traceability tags configured in the route linked to the inspection are shown. In particular, the name, the level and the values of each configured traceability tag are displayed.
ISO 6789:2003
Below are the items of the ISO 6789:2003 inspection result details card:
Inspection: name of the inspection.
Route: name of the route linked to the inspection.
Result date: date of the inspection.
Measuring device: measuring device used to do the inspection.
Target object: name of the tool under control.
Operator: Name of the operator that did the inspection.
It is shown if the measuring device manages the users.
Status: below are the available options, depending on the status of the inspection:
Partial: the inspection is closed before the batch is completed. The test can be completed later on.
Completed: the inspection execution is closed after the batch is completed.
Abandoned: the inspection execution is not completed but it is manually closed. The test cannot be completed later on.
Result status: below are the results of the execution:
OK: all the results are OK.
NOK: at least one result is NOK.
N/A: at least one test point is not executed.
Test point: for each test point, in the graph are displayed:
Percentage of the maximum torque of the tool.
Value of the test torque.
Result of the test point: OK, NOK, N/A.
Torque deviation chart.
Traceability: in this table the traceability tags configured in the route linked to the inspection are shown. In particular, the name, the level and the values of each configured traceability tag are displayed.
Tool model uncertainty
Below are the items of the ISO 6789:2017 inspection result details card:
Result date: date of the inspection result.
Measuring device: measuring device used to do the inspection.
Status: below are the available options, depending on the status of the inspection:
Partial: the inspection is closed before the batch is completed. The test can be completed later on.
Completed: the inspection execution is closed after the batch is completed.
Abandoned: the inspection execution is not completed but it is manually closed. The test cannot be completed later on.
Tool to inspect: name of the inspected tool.
Tool model: name of the tool model.
Uncertainty test type: below are the available options:
brep: variation due to the reproducibility.
bod: variation due to the geometric effects of the output drive of the torque tool.
bint: variation due to the interference between the output drive and the calibration system.
bl:variation due to the variation of the force loading point.
Tightening direction: tightening direction of the test. The available options are:
CW: clockwise direction.
CCW: counterclockwise direction.
Coefficient value: uncertainty value calculated for the uncertainty test type.
Number of phases: number of phases of the test.
ISO 6789:2017
Below are the items of the ISO 6789:2017 inspection result details card:
Inspection: name of the inspection.
Route: name of the route linked to the inspection.
Result date: date of the inspection.
Measuring device: measuring device used to do the inspection.
Target object: name of the tool under control.
Operator: Name of the operator that did the inspection.
It is shown if the measuring device manages the users.
Status: below are the available options, depending on the status of the inspection:
Partial: the inspection is closed before the batch is completed. The test can be completed later on.
Completed: the inspection execution is closed after the batch is completed.
Abandoned: the inspection execution is not completed but it is manually closed. The test cannot be completed later on.
Result status: below are the results of the execution:
OK: all the results are OK.
NOK: at least one result is NOK.
N/A: at least one test point is not executed.
Test point table: the test point table displays the following data:
Test points: the test point column shows the preload phase and the test point target values.
ās: the ās column shows the mean reference value determined by the measurement device.
W': the W' column shows the relative measurement uncertainty interval of the torque tool at the calibration torque.
Status: the Status column shows the Ok and NOK results.
as: expected measurement error defined in the inspection.
W': expected relative uncertainty error defined in the inspection.
Test point: for each test point, in the graph are displayed:
Value of the test torque.
Torque deviation chart.
Torque relative error chart
Statistics: below are the statistics of the execution:
Resolution (r): resolution value.
brep: type the value of the variation due to the reproducibility.
bod: type the variation due to the geometric effect of the output drive of the torque tool.
bint: type the value of the variation due to the interface between the output drive and the calibration system.
bl: type the value of the variation of the force loading point.
k: coverage factor applied to the relative measurement uncertainty.
Notes: comment written on STbench/STpad during the test.
Traceability: in this table the traceability tags configured in the route linked to the inspection are shown. In particular, the name, the level and the values of each configured traceability tag are displayed.
Data analysis for ISO 6789:2017
On the Inspection results details card, click one row of the Test point table to open the Data analysis card, related to the selected test point.
Below are the items of the Data analysis card:
Xr: mean reference value determined by the measurement device.
wr: relative standard measurement uncertainty due to resolution of the display of the torque tool (Type I and Type II Classes: A, D and G only).
wmd: relative standard measurement uncertainty of the measurement device at the calibration torque.
wrep: component of w due to reproducibility of the torque tool (Type I and Type II Classes A, D and G only).
wod: component of w due to geometric effects of the output drive of the torque tool.
wint: component of w due to geometric effects of the interface between the output drive of the torque tool and the calibration system.
wl: component of w due to the length variation of the force loading point.
bre: variation due to the repeatability of the torque tool.
wre: component of w due to the repeatability of the torque tool.
w: relative standard measurement uncertainty of the torque tool at the calibration torque.
W: relative expanded measurement uncertainty of the torque tool at the calibration torque.
bep: stated relative measurement error of the measurement device.
W': relative measurement uncertainty interval of the torque tool at the calibration torque.
W'md: relative measurement uncertainty interval of the measurement device at the calibration torque.
ās: mean reference determined by the measurement device.
Tool calibration
Below are the items of the Tool calibration inspection result details card:
Inspection: name of the inspection.
Route: name of the route linked to the inspection.
Result date: date of the inspection.
Measuring device: measuring device used to do the inspection.
Target object: name of the tool under control.
Operator: name of the operator that did the inspection.
It is shown if the measuring device manages the users.
Status: below are the available options, depending on the status of the inspection:
Partial: the inspection is closed before the batch is completed. The test can be completed later on.
Completed: the inspection execution is closed after the batch is completed.
Abandoned: the inspection execution is not completed but it is manually closed. The test cannot be completed later on.
Input type: below are the available options, depending on the input method used during the test:
Manual: the operator type the value measured by the controller.
Automatic: measuring device receives the value measured by the controller.
Control chart
Torque deviation [%] / tightening number: the graph shows two series of values related to the torque measured by the tool under calibration and the torque measured by the reference.
In the graphs, the lines indicate:
the upper and lower limits (red lines)
the target values (green line)
Click the chart to open a full screen graph.
Toque [Nm]/ tightening number: the graph shows the deviation in percentage between the torque measured by the tool under calibration and the torque measured by the reference.
Scale factor
Old: calibration value on the controller before the calibration.
New: calibration value calculated after the calibration.
Apply status: below are the available options, depending on the change of the calibration value of the controller:
None: the controller calibration value is not changed.
Manual: the operator changes the calibration value on the controller.
Automatic: measuring device sends the new calibration value to the controller.
Joint: name of the joint linked to the inspection.
Tolerance deviation
Tolerance: reference deviation value in percentage of the new calibration value from the old validation value.
Actual: deviation value in percentage of the new calibration value from the old validation value.
Traceability: in this table the traceability tags configured in the route linked to the inspection are shown. In particular, the name, the level and the values of each configured traceability tag are displayed.
VDI/VDE 2645-2
Below are the items of the VDI/VDE 2645-2 inspection result details card:
Inspection: name of the inspection.
Route: name of the route that contains the inspection.
Result date: date of the inspection.
Measuring device: measuring device used to do the inspection.
Operator: name of the operator that did the inspection. It is shown if the measuring device manages the users.
Target object: name of the joint under control.
Status: below are the available options, depending on the status of the inspection:
Partial: the inspection is closed before the batch is completed. The test can be completed later.
Completed: the inspection execution is closed after the batch is completed.
Abandoned: the inspection execution is not completed but it is manually closed. The test cannot be completed later.
Results status: below are the available options, depending on the result status of the inspection:
OK: all the results are OK.
NOK: at least one result is NOK.
Test point table
Test point: name of the test point.
Status: result status of the single test point.
Traceability: in this table the traceability tags configured in the route linked to the inspection are shown. In particular, the name, the level and the values of each configured traceability tag are displayed.
Data analysis for VDI/VDE 2645-2
On the Inspection results details card, click one row of the Test point table to open the Data analysis card, referred to the selected test point.
Below are the items of the Data analysis card:
Torque/angle: the minimum and current values of Cm-Cmk and the result status of the test point are shown.
Outliers (Grubbs test): the graph shows all the results of the test point. Under the graph, the number of outliers indicates the number of points out of the limits USL and LSL.
Change feature’s position (Swed-Eisenahrt test): Systematic change of measurements indicates if the measured values are randomly distributed (Systematic change of measurements = No) or not (Systematic change of measurements = Yes).
Departure from normal distribution (Epps-Pulley test): the graphs show the deviation of the results from the normal distribution. The parameter Normal distribution indicates if the measured values are distributed as a normal distribution or not.
In the Probability plot, the linear representation of the Normal distribution and the confidence intervals are displayed if the measured values are normally distributed.
When a test (Grubbs test, Swed-Eisenahrt test or Epp-Pulley test) is not passed, the following two fields are shown:
Cause known and effect accepted: details about the test not passed.
Comments: comment written by the operator after a test point is done.
JJF 1610:2017
Below are the items of the JJF 1610:2017 inspection result details card:
Inspection: name of the inspection.
Route: name of the route linked to the inspection.
Result date: date of the inspection.
Measuring device: measuring device used to do the inspection.
Target object: name of the tool inspected.
Status: below are the available options, depending on the status of the inspection:
Partial: the inspection is closed before the batch is completed. The test can be completed later on.
Completed: the inspection execution is closed after the batch is completed.
Abandoned: the inspection execution is not completed but it is manually closed. The test cannot be completed later on.
Calibration points table: the test point table displays the following data:
Calibration points: the calibration points column shows the preload phase and the results of each calibration point of high torque and low torque rate reading.
U [%]: the expanded uncertainty column shows the expanded uncertainty percentage of each calibration point of high torque and low torque rate reading.
Statistics: below are the statistics of the execution:
k: coverage factor applied to the relative measurement uncertainty.
Notes: comment written on STbench/STpad during the test.
Data analysis for JJF 1610:2017
On the Inspection results details card, click one row of the Test point table to open the Data analysis card, related to the selected test point.
Below are the items of the Data analysis card:
Xr: mean reference value determined by the measurement device.
δ; relative tolerance.
R: repeatability.
c1: derived sensitivity coefficient.
c2: derived sensitivity coefficient.
uR: experimental standard deviation of the measurement average.
ub: standard uncertainty.
Ubrel: expanded uncertainty of the torque meter.
u: combined standard uncertainty.
U: expanded uncertainty.
Cp/Cpk (joint/dimensional)
Below are the items of the Cp/Cpk (joint/dimensional) inspection results details card:
Inspection: name of the inspection.
Route: name of the route linked to the inspection.
Result date: date of the inspection.
Measuring device: measuring device used to do the inspection.
Target object: name of the joint under control.
This item is displayed only for the Cp/Cpk Joint check.
Operator: name of the operator that performed the inspection. It is shown if the measuring device manages the users.
Status: below are the available options, depending on the status of the inspection:
Partial: the inspection is closed before the batch is completed. The test can be completed later.
Completed: the inspection execution is closed after the batch is completed.
Abandoned: the inspection execution is not completed but it is manually closed. The test can not be completed later.
Results status: below are the available options, depending on the result status of the inspection:
OK: all the results are OK.
NOK: at least one result is NOK.
Control Chart
Torque/angle/dimension: the graphs shows the physical characteristics values measured during the test.
In the graphs, the lines indicate:
Minimum and maximum values (red lines)
Nominal value (green line)
Click on the chart to open a full screen.
Statistics
Torque/physical quantity: below are the statistics of torque, angle, torque and angle or physical quantity:
Minimum Cp and Cpk
Actual Cp and Cpk
Average value
σ: standard deviation
Average values +/- 3σ
Traceability: in this table the traceability tags configured in the route linked to the inspection are shown. In particular, the name, the level and the values of each configured traceability tag are displayed.
SPC joint/dimensional
Below are the items of the SPC joint check/dimensional inspection result details card:
Inspection: name of the inspection.
Route: name of the route linked to the inspection.
Result date: date of the inspection.
Measuring device: measuring device used to do the inspection.
Operator: name of the operator that performed the inspection. It is shown if the measuring device manages the users.
Target object: name of the joint under control. This item is displayed only for the SPC joint check.
Status: below are the available options, depending on the status of the inspection:
Partial: the inspection is closed before the batch is completed. The test can be completed later.
Completed: the inspection execution is closed after the batch is completed.
Abandoned: the inspection execution is not completed but it is manually closed. The test cannot be completed later.
Results status: below are the available options, depending on the result status of the inspection:
OK: all the results of the completed subgroup or completed batch are OK.
NOK: at least one result of the completed subgroup or completed batch is NOK.
No status: if the ongoing subgroup is not completed, the status of the batch cannot be evaluated and is left blank.
X/R Chart
X chart: The last point is the average of the last execution. The previous points are the average values of the inspection done before.
In the graphs, the lines indicate:
the upper and lower limits (red lines)
the target values (green line)
target value +/- 3σ (blue lines) (σ is the standard deviation)
Click on the chart to open a full screen graph.
R chart: The last point is the average of the last execution. The previous points are the average values of the inspection done before.
In the graphs, the lines indicate:
the upper and lower limits (red lines)
the target values (green line)
target value +/- 3σ (blue lines) (σ is the standard deviation)
Click on the chart to open a full screen graph.
SPC Rules
List of the rules applied with the result (OK/NOK/NA) for each rule.
Traceability: in this table the traceability tags configured in the route linked to the inspection are shown. In particular, the name, the level and the values of each configured traceability tag are displayed.
Attribute
Below are the items of the Attribute inspection result details card:
Inspection: name of the inspection.
Route: name of the route linked to the inspection.
Result date: date of the inspection.
Measuring device: measuring device used to do the inspection.
Status: below are the available options, depending on the status of the inspection:
Partial: the inspection is closed before the batch is completed. The test can be completed later on.
Completed: the inspection execution is closed after the batch is completed.
Abandoned: the inspection execution is not completed but it is manually closed. The test cannot be completed later on.
NOK results tolerance: amount of NOK results related to the total number of results.
Results status: below are the available options, depending on the result status of the inspection:
OK: all the results are OK.
NOK: at least one result is NOK.
Traceability: in this table the traceability tags configured in the route linked to the inspection are shown. In particular, the name, the level and the values of each configured traceability tag are displayed.
Binary
Below are the items of the Binary inspection result details card:
Inspection: name of the inspection.
Route: name of the route linked to the inspection.
Result date: date of the inspection.
Measuring device: measuring device used to do the inspection.
Status: below are the available options, depending on the status of the inspection:
Partial: the inspection is closed before the batch is completed. The test can be completed later on.
Completed: the inspection execution is closed after the batch is completed.
Abandoned: the inspection execution is not completed but it is manually closed. The test cannot be completed later on.
NOK results tolerance: amount of NOK results related to the total number of results.
Results status: below are the available options, depending on the result status of the inspection:
OK: all the results are OK.
NOK: at least one result is NOK.
Traceability: in this table the traceability tags configured in the route linked to the inspection are shown. In particular, the name, the level and the values of each configured traceability tag are displayed.
By part
Below are the items of the By part inspection result details card:
Inspection: name of the inspection.
Route: name of the route linked to the inspection.
Result date: date of the inspection.
Measuring device: measuring device used to do the inspection.
Status: below are the available options, depending on the status of the inspection:
Partial: the inspection is closed before the batch is completed. The test can be completed later on.
Completed: the inspection execution is closed after the batch is completed.
Abandoned: the inspection execution is not completed but it is manually closed. The test cannot be completed later on.
Results status: below are the available options, depending on the result status of the inspection:
OK: all the results are OK.
NOK: at least one result is NOK.
Inspection By part results: table with the list of the inspections configured in the By part inspection. For each inspection of the list, the name, the status and the result status are shown.
Clicking the results in the list, the relative inspection result details card opens.
Traceability: in this table the traceability tags configured in the route linked to the inspection are shown. In particular, the name, the level and the values of each configured traceability tag are displayed.
Usage counter
Below are the items of the Usage counter inspection result details card:
Inspection: name of the inspection.
Result date: date of the inspection result.
Status: below are the available options, depending on the status of the inspection:
Partial: the inspection is closed before the batch is completed. The test can be completed later on.
Completed: the inspection execution is closed after the batch is completed.
Abandoned: the inspection execution is not completed but it is manually closed. The test cannot be completed later on.
Results status: below are the available options, depending on the result status of the inspection:
OK: all the results are OK.
NOK: at least one result is NOK.
Threshold value: threshold value set in the scheduling.
Usage counter: number of cycles of the tool.
SPC (prod)
Below are the items of the SPC (prod) inspection result details card:
Inspection: name of the inspection.
Result date: date of the inspection result.
Status: completed.
Results status: NOK.
X/R Chart
X chart: chart of the average values. The last point is the average of the last subgroup. The previous points are the average values of the subgroups done before.
In the graphs, the lines indicate the upper and lower control limits (orange lines) if the measurement type is set to Average.
Click the chart to open a full screen graph.
R chart: chart of the range (maximum measured values - minimum measured values).
The last point is the range of the last execution. The previous points are the range values of the execution done before.
In the graphs, the lines indicate the upper and lower control limits (orange lines) if the measurement type is set to Range.
Click the chart to open a full screen graph.
Serial number: serial number of the tool.
Measurement of: Torque/Angle.
Measurement type: Average/Range.
SPC rule name: name of the SPC rule set in ToolsNet.
SPC rule failed: name of the SPC rule failed, below the available options:
Group outside of control limits: one or more groups are outside the upper control limit (UCL) or lower control limit (LCL).
Groups increasing or decreasing: 7 or more consecutive increasing or decreasing groups.
Group above or below average: 7 or more consecutive groups above or below average
Group size: number of results used for a sample set in ToolsNet.
High limit: high limit set in ToolsNet.
Target value: target value set in ToolsNet
Low limit: low limit set in ToolsNet
Upper control limit: upper control limit set in ToolsNet
Lower control limit: low control limit set in ToolsNet
Instruction
Below are the items of the Instruction inspection result details card:
Inspection: name of the inspection.
Route: name of the route linked to the inspection.
Result date: date of the inspection.
Measuring device: measuring device used to do the inspection.
Operator: name of the operator that did the inspection.
Status: below are the available options, depending on the status of the inspection:
Partial: the inspection is closed before the batch is completed. The test can be completed later on.
Completed: the inspection execution is closed after the batch is completed.
Abandoned: the inspection execution is not completed but it is manually closed. The test cannot be completed later on.
Results status: below are the available options, depending on the result status of the inspection:
OK: all the results are OK.
NOK: at least one result is NOK.
Picture: image acquired during the test.
Picture
Below are the items of the Picture inspection result details card:
Inspection: name of the inspection.
Route: name of the route linked to the inspection.
Result date: date of the inspection.
Measuring device: measuring device used to do the inspection.
Operator: name of the operator that did the inspection.
Status: below are the available options, depending on the status of the inspection:
Partial: the inspection is closed before the batch is completed. The test can be completed later on.
Completed: the inspection execution is closed after the batch is completed.
Abandoned: the inspection execution is not completed but it is manually closed. The test cannot be completed later on.
Results status: below are the available options, depending on the result status of the inspection:
OK: all the results are OK.
NOK: at least one result is NOK.
Picture: image acquired during the test.
Data
On the upper-right corner of the Inspection Result Details card, click Data to open the Data Details card. This card is available for all the inspection, except for SPC (prod) and Usage counter.
For VDI/VDE 2645-2, ISO 6789:2017 and JJF 1610:2017, the Data Details card is available from the Data analysis card.
The Data Details card shows the results table(s).
The NOK results are highlighted with a red mark.
For Cm/Cmk, Cp/Cpk, and SPC inspections, the upper part of the Data Details card shows the target and the limits of the inspection.
If the Target source is set to Multistep, the results are related to a single step.
For the ISO 6789:2003 and ISO 5393 inspections, the Data Details card shows the test points.
Under the results table(s), the Traceability table is shown.
After selecting a result in the result table, in the Traceability table, the following items are shown:
Seq#: number that indicates which tightening is analyzed (for example, 1 is the first tightening of the sequence).
Test point: description of the test point (for example, for ISO 5393 an available description is Lower torque level - Lower torque rate).
Date: date of the test.
Transducer S/N: serial number of the transducer used for the test.
Speed: speed of the tool in rpm. This value is available only for power tool.
Pictures: picture linked to the selected result.
Notes: comment written on STbench/STpad/STpalm during the test. It is related to the single point highlighted in the result table.
Assignable cause: assignable cause identified by the operator.
Corrective action: corrective action done by the operator.
These items are specific for the inspections. For example, Test points are shown only for ISO 5393, ISO 6789:2003.
If the option "Display in pages and export" of the Deleted measurements is enabled in the Application settings, the measurements deleted during tests made by STpad/STpalm/STbench are shown. The deleted values are struck through.
If the option "Display in pages and export" of the Not detected measurements is enabled in the Application settings, the measurements not detected during tests made by STpad/STpalm/STbench are shown. The not detected values are marked with a dash.
Traces
Traces are available only for the following methods: Cm/Cmk, Cp/Cpk (tool/joint), SPC (tool/joint) and Tool Calibration and if the function is enabled on the measuring device.
On the upper-right corner of the Inspection Result Details card, click Data to open the Data Details card.
On the upper-right corner of the Data Details card, click Traces to open the Curve Plot card.
On the upper-right corner of the Curve Plot workspace, there are the following command buttons:
Close button: click to close the curve plot card.
Offset: click to change the offset of the curve.
Click the Offset icon to start the curve from the start final angle (and not from the transducer min load).
Fullscreen: click to open a full-screen plot.
Chart type: click to select the type of the plot to be displayed.
Select between:
Torque over time (plot of the torque in function of the time)
Angle over time (plot of the angle in function of the time)
Torque/Angle over time (plot of both torque and angle in function of the time)
Torque over angle (plot of torque in function of the angle)
Linearity check (plot of the linearity of the torque trace). This option is available only for VDI/VDE 2645-2 inspections.
If the measured value is OK, it is displayed as a grey circle.
If the measured value is NOK, it is displayed as a red cross.
In the case the double peak function for the residual measures is enabled on the measuring device, in addition of the residual point also the peak point is shown and it is marked with a triangle on the curve plot.
If the peak value is OK, it is displayed as a grey triangle.
If the peak value is NOK, it is displayed as a red triangle.
The residual value is the torque value at which the joint is tightened.
The peak value is the maximum value measured during the test.
Export as: click on the CSV button to export the traces in a comma-separated values file, or the TSV button to export the traces in a in a tab-separated values file.
Setting the results filter
On the left-side menu bar, click Inspections > Results.
On the upper-right corner of the Inspection Results workspace, click Filter.
In the Inspection Results Filter dialog box, set the result filter criteria (depending on the customer needs).
On the upper-right corner of the Inspections Results Filter dialog box, click Apply.
Results filter criteria
Tool check data: type the name, serial number, or identifier of the Tool.
Joint check data: type the name or identifier of the Joint.
Inspections: in the Inspections box, select the necessary inspection.
To select an inspection, click Search icon (
). In the Inspections Definitions workspace, select the necessary inspection.
Then, click Apply.
To delete an inspection, in the Inspections box, select it.
Then, click Delete icon (
).
Routes: in the Routes box, select the necessary route.
To select a route, click Search icon (
). In the Routes workspace, select the necessary route.
Then, click Apply.
To delete a route, in the Route box, select it.
Then, click Delete icon (
).
Type: select one or more inspection type(s) to filter. In addiction to all the inspection types manage by QA Supervisor, also the type Productions is displayed.
Method: select one or more method to filter. All the methods of the type selected in the Type box are shown. If no Type is selected, all the methods are displayed.
Operator: type the name of the operator to filter
Traceability tag: type the value of the traceability tag to filter. If two values are typed with an empty space with them, an OR filter is applied.
For example: in the Traceability tag text box type Tag1 Tag2 and apply the filter. All the inspection with the Traceability tag set to Tag1 and all the inspection with Traceability tag set to Tag2 are displayed.
Status: select one of the following options, depending on the status of the inspection to be filtered:
Partial: the inspection is closed before the batch is completed. The test can be completed later on.
Completed: the inspection execution is closed after the batch is completed.
Abandoned: the inspection execution is not completed but it is manually closed. The test cannot be completed later on.
It is possible to select more than one status in the filter.
Result status: select either OK or NOK, depending on the result of the execution to be filtered.
Measuring devices: in the Measuring devices box, select the necessary measuring device.
To select a measuring device, click Search icon (
).In the Measuring Devices workspace, select the necessary measuring device.
Then, click Apply.
To delete a measuring device, in the Measuring devices box, select it.
Then, click Delete icon (
).
Date range: filter the data range.
Do one of the following:
From - to: click the box: a calendar opens. Select the date from the calendar.
Click Delete icon (
) to delete a date already configured.Range: in the drop-down list, select a specific time interval.
Selected filter: from the drop-down list, select one of the saved customized filter.
For more information on how to manage customized filters, refer to Filters customization.
Exporting results
On the upper-right corner of the page, click Export.
An Excel file is created with all the saved results.
If the Display in pages and export function of the Deleted measurements is enabled in the Application settings, the measurements deleted during tests made by STpad, STpalm and STbench are shown.
If some filters are applied to the list, only the filtered items are exported.
Definitions
On the left-side menu bar, click Inspections > Definitions.
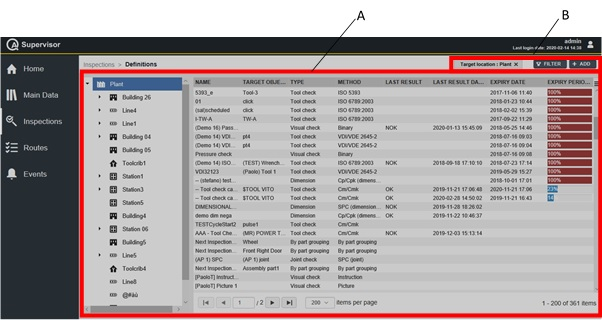
A | Definitions workspace | B | Command buttons |
On the left side of the Definitions workspace, the tree view shows the hierarchical structure of the plant. Click the arrow on the left of the element of the factory structure to show the related sub-element(s).
By selecting an item of the factory structure, the inspection definitions are filtered.
On the right side of the Definitions workspace, all of the inspections of a selected element of the plant (see the left side of the Definitions workspace) are displayed.
The right side of the Definitions workspace is divided into the following columns:
Name: name of the inspection.
Target object: name of the tool under control.
Type: type of the inspection.
Method: method of the quality control (Cm/Cmk, SPC, ISO 6789, and ISO 5393).
Last result: result of the last inspection (OK and NOK).
Last result date: date of the result of the last inspection.
Expiry date: after scheduling a specific inspection, the expiry period shows the date and time on which an inspection can be used (starting from the related last result date).
Expiry period: due date for a planned inspection activity. After the due date, if a new inspection is not performed, the previous one is no more valid. Then, the process is no more under control.
In the Definitions workspace, click an inspection to display the related Inspection Definition Details card.
On the upper-right corner of the Inspection Definition Details card, click the Close button to exit the Inspection Definition Details card (without saving any change).
If the message “Toolcheck feature not licensed” is displayed on the top of the Inspection Details card, it is only possible to add a new inspection or edit, clone and display the inspection executions already configured.
At the bottom of the Inspection Definition Details card, the following items record all the changes made for the selected inspection:
History: the history table records all the changes made for the selected inspection.
The first line of the history table summarizes the latest version of the inspection configuration. Click a previous line: the related Inspection Definition Details card opens on the left of the Inspection Definition Details card related to the latest version. The differences between the two Inspection Definition Details cards are highlighted in yellow.
On the upper-right corner of the oldest Inspection Definition Details card, click Restore: the previous version of the inspection configuration becomes the latest one.
Version: version of the inspection configuration.
In the Inspection Edit dialog box, change one of the following items to make a new version: Inspection, Scheduling, Name, Inspection method, Tool, Joint, and Status.
Changed by: name of the operator who has made a change to the inspection configuration.
Changed on: optional field, it appears only if the change has made by an operator on a device.
The restored inspection is linked to the scheduling and tool(s) of the latest version in use.
On the upper-right corner of the Definitions workspace, there are the following command buttons:
Add: click to add a new inspection into the Definitions workspace.
It is possible to create new tool check inspections only for tool whose status is either In use, Backup or Toolcrib.
It is possible to create new joint check inspections only for joints whose status is In use.
Filter: click to give filters and list only the necessary inspection(s).
It is possible to save two inspection with the same name and the same target objet. A warning message is displayed to inform the operator that an inspection with the same name already exists.
Select Yes to save the inspection.
Select No to discard the inspection.
- Adding an inspection
- Editing an Inspection Definition Details card
- Running an inspection
- Tool check inspection
- Joint check inspection
- Visual check inspection
- Dimensional check inspection
- By part grouping inspection
- Cloning an Inspection Definition Details card
- Displaying the Inspection Results
- Setting the inspection filter
- Inspection filter criteria
Adding an inspection
On the left-side menu bar, click Inspections > Definitions.
On the upper-right corner of the Definitions workspace, click Add.
In the Add inspection definition dialog box, configure the inspection parameters.
On the upper-right corner of the Add inspection definition dialog box, click Save.
Editing an Inspection Definition Details card
On the upper-right corner of the Inspection Definition Details card, click Edit.
In the Edit Inspection Definition dialog box, make the necessary changes.
On the upper-right corner of the Edit Inspection Definition card, click Save.
By modifying the Inspection parameters, a new version of the inspection is created and the statistics are reset.
As an example: if an SPC inspection is edited, the last result fields are erased and the old measures are not used for a new statistic.
The following is a list of parameters that, if edited, do not change the test definition and thus do not reset the statistics: Name, Location, Scheduling by time, Scheduling by tool usage, Scheduling by SPC failed, Input type.
Running an inspection
On the upper-right corner of the Inspection Definition Details card, click Run to send the selected inspection to the measuring device configured in the Personal settings.
If no measuring device is configured in the Personal settings, the Run button is disabled.
To configure a measuring device, please refer to the paragraph "Viewing/editing personal settings".
If the inspection is correctly sent to the measuring device, a green notification message is displayed.
If the inspection is not sent to the measuring device, an error message alerts the user about the problem that occurred.
This functionality sends an inspection to the measuring device and runs it, the success of the running operation has to be verified on the measuring device.
Tool check inspection
Cm/Cmk parameters
Name (*): type the name of the inspection.
Barcode identifier (*): it identifies the inspection. If left blank, the identifier corresponds to the inspection name. When a barcode is scanned on the measuring device, the matching inspections are sent to the device.
Enable barcode regex: click the switch to enable the barcode regex feature. For more information, refer to Barcode regex.
Type: select Tool check in the drop down list.
Tool to inspect (*): add/select the tool to inspect.
Do one of the following:
Click Add icon (
) to add a new tool to inspect. In the Add Tool dialog box, enter the details related to the tool to inspect.
Then, click Save.
Click Search icon (
) to select a tool already configured. In the Tools workspace, select the necessary tool.
Then, click Apply.
Tool model: model of the selected tool. This item is automatically filled in after selecting the tool.
Location: location of the tool. This item is automatically filled in after selecting the tool.
Method (*): in the drop-down list, select Cm/Cmk.
Scheduling by time: add/select/delete the scheduling.
Do one of the following:
Click Add icon (
) to add a new scheduling. In the Add Scheduling dialog box, enter the details related to the new scheduling. The Type is set to Time.
Then, click Save.
Click Search icon (
) to select a scheduling already configured. In the Scheduling workspace, select the necessary scheduling. Only the Scheduling by time are shown.
Then, click Apply.
Click Delete icon (
) to delete the selected scheduling.
ToolsNet 8
Scheduling by tool usage: add/select/delete the scheduling.
Do one of the following:
Click Add icon (
) to add a new scheduling. In the Add Scheduling dialog box, enter the details related to the new scheduling. The Type is set to Tool usage counter.
Then, click Save.
Click Search icon (
) to select a scheduling already configured. In the Scheduling workspace, select the necessary scheduling. Only the Scheduling by tool usage are shown.
Then, click Apply.
Click Delete icon (
) to delete the selected scheduling.
Scheduling by SPC failed: enabling this check, the inspection expires if an SPC linked to the Tool fails in production.
Parameters
Target source (*): select one of the following options:
Position based
Tool based
Multistep
This item is available only for the Power tool.Production based
Joint (*): in the box, select the necessary joint.
To add a new joint, click Add icon (
).In the Add Joint dialog box, enter the details related to new joint.
Then, click Save.
This item is shown only if the Target source is set to Position based.
Multistep: add/select a multistep.
Do one of the following:
Click Add icon (
) to add a new multistep. In the Add Multistep Program dialog box, enter the details related to the new multistep.
Then, click Save.
Click Search icon (
) to select a multistep already configured. In the Multisteps workspace, select the necessary multistep.
Then, click Apply.
This item is shown only if the Target source is set to Multistep.
Tightening program (*): select the Tightening program from ToolsNet 8.
Click Search icon (
) to select a Tightening program configured.In the Programs workspace, select the necessary Tightening program.
Then, click Apply.
This item is shown only if the Target source is set to Production based.
Number of samples: type the number of tightenings to be done.
The value can range from 0 to 1000. If the number of sample is not defined or equal to 0, the test is run with no batch count.
AutoRestart: click on the switch to enable/disable the automatic restart of the batch count when it is completed.
Tightening direction (*): select CW (clockwise direction) or CCW (counterclockwise direction).
If the Target source is set to Position based, the Tightening direction depends on the joint configuration.
If the Target source is set to Multistep, the Tightening direction is not displayed.
Check type (*): select one of the following options:
Only torque: only the torque is controlled.
Torque and angle: the torque is controlled and the angle is monitored.
Only angle: only the angle is controlled.
Angle and torque: the angle is controlled and the torque is monitored.
If the Target source is set to Multistep, the check type is not displayed.
Measurement unit (*): select the measuring unit for the inspection.
The default measurement unit is defined both in the Application settings and in the Personal settings.
Required transducer: add/select/delete the transducer.
Do one of the following:
Click Add icon (
) to add a new transducer. In the Add Transducer dialog box, enter the details related to the new transducer.
Then, click Save.
Click Search icon (
) to select a transducer already configured. In the Transducers workspace, select the necessary transducer.
Then, click Apply.
Click Delete icon (
) to delete the selected transducer.
Simulated trace
Simulated trace is displayed only if a joint linked to a simulated trace has been selected during the inspection definition.
Trace (*): name of trace linked to the selected joint.
Chart of the simulated trace.
Torque
Torque is displayed only if the check type is Only torque, Torque and angle, and Angle and torque.
Torque values (*): type the torque target and the torque limits.
The torque values can be given as follows:
Torque target and torque tolerance
Lower limit (LSL) and upper limit (USL)
Percentage of operating range and torque tolerance
Click either the right or the left arrow to change the view of the torque values.
If the target source is Position based, the torque target is the tightening torque of the joint. This is a read-only value.
If the target source is Production based, the torque target is the tightening torque of the program. This is a read-only value.
If the target source is Tool based / Multistep, the default torque target is the maximum torque configured in the tool model.
Cm min (*): type the minimum value of Cm for the torque.
Cmk min (*): type the minimum value of Cmk for the torque.
Angle for simulation (*): type the angle value to simulate the joint. The default value is 270°.
Angle for simulation is displayed only if the check type is Only torque.
Final angle monitoring torque (*): it specifies the torque value from which the angle measurement starts.
For the older products, this item is indicated as Start final angle.
Two different definition types are available:
Value expressed in the selected measurement unit.
Percentage value of target torque
Click either the right or the left arrow to change the view of the final angle monitoring torque.
Final angle monitoring torque is displayed only if the check type is Only torque and the strategy is Direct driven or Peak.
Torsion Angle
Torsion Angle is displayed only if the check type is Only angle, Torque and angle, and Angle and torque.
Torsion angle (*): type the angle target and the torque limits.
The torque values can be given as follows:
Angle target and angle tolerance
Lower limit (LSL) and upper limit (USL)
Click either the right or the left arrow to change the view of the angle values.
If the target source is Position based, the Angle target is the Torsion angle of the joint. This is a read-only value.
If the target source is Production based, the Angle target is the Target angle of the program. This is a read-only value.
Measure angle from: from the drop-down list, select between:
One step: the measurement of the angle starts as soon as the Final monitoring torque value is reached.
Second step: the measurement of the angle starts in the second step, when the Final angle monitoring torque value is reached.
Starting second step: the measurement of the angle starts at the starting of the second step.
This parameter is available only for power tools.
Final angle monitoring torque (*): it specifies the torque value from which the angle measurement starts.
For the older products, this item is indicated as Start final angle.
Two different definition types are available:
Value expressed in the selected measurement unit.
Percentage value of target torque
Click either the right or the left arrow to change the view of the final angle monitoring torque.
Cm min (*): type the minimum value of Cm for the angle.
Cmk min (*): type the minimum value of Cmk for the angle.
Torque for simulation (*): type the torque value to simulate the joint.
The default value is 100% of the operating range of the tool.
Torque for simulation is displayed only if the check type is Only angle.
Advanced parameters
Enter the required parameters. Refer to the paragraph Advanced parameters for the definition of all the parameters.
The Advanced Parameters depend on the tool model.
The default value of the Advanced parameters are defined in the Application settings.
Operator guidance
Picture: click the icon to upload an image (max 5 MB) or a video (max 10 MB). This image is sent to STpad/STpalm/STbench.
Instructions: type text instructions to guide the operator in the inspection run.
Verification code: type the verification code that must be entered or scanned when the inspection is run. This field is case-sensitive.
Verification code description: to guide the operator, type the description of the verification code dialog box that is displayed when the inspection is run.
Assignable causes/Corrective actions
Assignable cause: add/select an assignable cause. Do the following:
Click Add icon (
) to add a new assignable cause. In the Add selectable dialog box, enter the details related to the new assignable causes.
Then, click Save.
Click Search icon (
) to select an assignable cause already configured. In the Selectable workspace, select the necessary assignable cause. The displayed items are all the available assignable causes filtered from the selectable list.
Then, click Apply.
Optional: click the Optional switch to do the test without selecting the assignable cause.
Allow manual input: click the Allow manual input switch to enable the possibility to add manually a value. This value is saved only for the inspection, it is not added to the assignable cause.
Corrective action: add/select an assignable cause. Do the following:
Click Add icon (
) to add a new corrective action. In the Add selectable dialog box, enter the details related to the new corrective action.
Then, click Save.
Click Search icon (
) to select a corrective action already configured. In the Selectable workspace, select the necessary corrective action. The displayed items are all the available corrective action filtered from the selectable list.
Then, click Apply.
Optional: click the Optional switch to do the test without selecting the corrective action.
Allow manual input: click the Allow manual input switch to enable the possibility to add manually a value. This value is saved only for the inspection, it is not added to the corrective action.
Items marked with an asterisk (*) are required.
SPC tool check parameters
Name (*): type the name of the inspection.
Barcode identifier (*): it identifies the inspection. If left blank, the identifier corresponds to the inspection name. When a barcode is scanned on the measuring device, the matching inspections are sent to the device.
Enable barcode regex: click the switch to enable the barcode regex feature. For more information, refer to Barcode regex.
Type: select Tool check from the drop down list.
Tool to inspect (*): add/select the tool to inspect.
Do one of the following:
Click Add icon (
) to add a new tool to inspect. In the Add Tool dialog box, enter the details related to the tool to inspect.
Then, click Save.
Click Search icon (
) to select a tool already configured. In the Tools workspace, select the necessary tool.
Then, click Apply.
Tool model: model of the selected tool. This item is automatically filled in after selecting the tool.
Location : location of the tool. This item is automatically filled in after selecting the tool.
Method (*): in the drop-down list, select SPC (tool).
Scheduling by time: add/select/delete the scheduling.
Do one of the following:
Click Add icon (
) to add a new scheduling. In the Add Scheduling dialog box, enter the details related to the new scheduling. The Type is set to Time.
Then, click Save.
Click Search icon (
) to select a scheduling already configured. In the Scheduling workspace, select the necessary scheduling. Only the Scheduling by time are shown.
Then, click Apply.
Click Delete icon (
) to delete the selected scheduling.
ToolsNet 8
Scheduling by tool usage: add/select/delete the scheduling.
Do one of the following:
Click Add icon (
) to add a new scheduling. In the Add Scheduling dialog box, enter the details related to the new scheduling. The Type is set to Tool usage counter.
Then, click Save.
Click Search icon (
) to select a scheduling already configured. In the Scheduling workspace, select the necessary scheduling. Only the Scheduling by tool usage are shown.
Then, click Apply.
Click Delete icon (
) to delete the selected scheduling.
Scheduling by SPC failure: enabling this check, the inspection expires if an SPC linked to the Tool fails in production.
Parameters
Target source (*): select Position based, Tool based or Production based.
Joint (*): in the box, select the necessary joint.
To add a new joint, click Add icon (
).In the Add Joint dialog box, enter the details related to new joint.
Then, click Save.
This item is shown only if the Target source is set to Position based.
Number of samples: type the number of tightenings to be done.
The value can range from 0 to 1000. If the number of sample is not defined or equal to 0, the test is run with no batch count.
AutoRestart: click on the switch to enable/disable the automatic restart of the batch count when it is completed.
Subgroup size: type the number of tightening to calculate the statistics.
Subgroup frequency: type the frequency of the averages displayed in the X chart and in the SPC rules.
For example:
Subgroup Frequency = 1: all subgroups are considered.
Subgroup Frequency = 2: one subgroup every 2 subgroups is considered.
Subgroup Frequency = X: one subgroup every X subgroups is considered.
Tightening direction (*): select CW (clockwise direction) or CCW (counterclockwise direction).
If the Target source is set to Position based, the Tightening direction depends on the joint configuration.
If the Target source is set to Multistep, the tightening direction is not displayed.
Tightening program (*): select the Tightening program from ToolsNet 8.
Click Search icon (
) to select a Tightening program configured.In the Programs workspace, select the necessary Tightening program.
Then, click Apply.
This item is shown only if the Target source is set to Production based.
Check type (*): select one of the following options:
Only torque: only the torque is controlled.
Torque and angle: the torque is controlled and the angle is monitored.
Only angle: only the angle is controlled.
Angle and torque: the angle is controlled and the torque is monitored.
If the Target source is set to Multistep, the Check type is not displayed.
Measurement unit (*): select the measuring unit for the inspection.
The default measurement unit is defined both in the Application settings and in the Personal settings.
Required transducer: add/select/delete the transducer.
Do one of the following:
Click Add icon (
) to add a new transducer. In the Add Transducer dialog box, enter the details related to the new transducer.
Then, click Save.
Click Search icon (
) to select a transducer already configured. In the Transducers workspace, select the necessary transducer.
Then, click Apply.
Click Delete icon (
) to delete the selected transducer.
Simulated trace
Simulated trace is displayed only if a joint linked to a simulated trace has been selected during the inspection definition.
Trace (*): name of trace linked to the selected joint.
Chart of the simulated trace.
Torque
Torque is displayed if the Check type is set to Only torque, Torque and angle, and Angle and torque.
Torque values (*): type the torque target and the torque limits.
The torque values can be given as follows:
Torque target and torque tolerance
Lower limit (LSL) and upper limit (USL)
Percentage of operating range and torque tolerance
Click either the right or the left arrow to change the view of the torque values.
If the Target source is set to Position based, the Torque target is set to the Tightening torque of the joint. This is a read-only value.
If the Target source is Production based, the Torque target is the Tightening torque of the joint. This is a read-only value.
If the Target source is set to Tool based / Multistep, the default Torque target is set to the Maximum torque configured in the tool model.
Angle for simulation (*): type the angle value to simulate the joint. The default value is 270°.
Angle for simulation is displayed only if the Check type is set to Only torque.
Torsion Angle
Torsion Angle is displayed if the Check type is set to Only angle, Torque and angle, and Angle and torque.
Torsion angle (*): type the angle target and the torque limits.
The angle values can be given as follows:
Angle target and angle tolerance
Lower limit (LSL) and upper limit (USL)
Click either the right or the left arrow to change the view of the angle values.
If the Target source is set to Position based, the Angle target is the Torsion angle of the joint. This is a read-only value.
If the target source is Production based, the Angle target is the Target angle of the program. This is a read-only value.
Measure angle from: from the drop-down list, select between:
One step: the measurement of the angle starts as soon as the Final monitoring torque value is reached.
Second step: the measurement of the angle starts in the second step, when the Final angle monitoring torque value is reached.
Starting second step: the measurement of the angle starts at the starting of the second step.
This parameter is available only for power tools.
Final angle monitoring torque (*): it specifies the torque value from which the angle measurement starts.
For the older products, this item is indicated as Start final angle.
Two different definition types are available:
Value in N·m
Percentage value of target torque
Click either the right or the left arrow to change the view of the final angle monitoring torque.
Torque for simulation (*): type the torque value to simulate the joint.
The default value is 100% of the operating range of the tool.
Torque for simulation is displayed only if the Check type is set to Only angle.
Advanced parameters
Enter the required parameters. Refer to the paragraph Advanced parameters for the definition of all the parameters.
The Advanced Parameters depend on the tool model.
The default value of the Advanced parameters are defined in the Application settings.
Operator guidance
Picture: click the icon to upload an image (max 5 MB) or a video (max 10 MB). This image is sent to STpad/STpalm/STbench.
Instructions: type text instructions to guide the operator in the inspection run.
Verification code: type the verification code that must be entered or scanned when the inspection is run. This field is case-sensitive.
Verification code description: to guide the operator, type the description of the verification code dialog box that is displayed when the inspection is run.
Assignable causes/Corrective action
Assignable cause: add/select an assignable cause. Do the following:
Click Add icon (
) to add a new assignable cause. In the Add selectable dialog box, enter the details related to the new assignable causes.
Then, click Save.
Click Search icon (
) to select an assignable cause already configured. In the Selectable workspace, select the necessary assignable cause. The displayed items are all the available assignable causes filtered from the selectable list.
Then, click Apply.
Optional: click the Optional switch to do the test without selecting the assignable cause.
Allow manual input: click the Allow manual input switch to enable the possibility to add manually a value. This value is saved only for the inspection, it is not added to the assignable cause.
Corrective action: add/select an assignable cause. Do the following:
Click Add icon (
) to add a new corrective action. In the Add selectable dialog box, enter the details related to the new corrective action.
Then, click Save.
Click Search icon (
) to select a corrective action already configured. In the Selectable workspace, select the necessary corrective action. The displayed items are all the available corrective action filtered from the selectable list.
Then, click Apply.
Optional: click the Optional switch to do the test without selecting the corrective action.
Allow manual input: click the Allow manual input switch to enable the possibility to add manually a value. This value is saved only for the inspection, it is not added to the corrective action.
Items marked with an asterisk (*) are required.
ISO 5393 parameters
Name (*): type the name of the inspection.
Barcode identifier (*): it identifies the inspection. If left blank, the identifier corresponds to the inspection name. When a barcode is scanned on the measuring device, the matching inspections are sent to the device.
Enable barcode regex: click the switch to enable the barcode regex feature. For more information, refer to Barcode regex.
Type: select Tool check from the drop down list.
Tool to inspect (*): add/select the tool to inspect.
Do one of the following:
Click Add icon (
) to add a new tool to inspect. In the Add Tool dialog box, enter the details related to the tool to inspect.
Then, click Save.
Click Search icon (
) to select a tool already configured. In the Tools workspace, select the necessary tool.
Then, click Apply.
Tool model: model of the selected tool. This item is automatically filled in after selecting the tool.
Location: location of the tool. This item is automatically filled in after selecting the tool.
Method (*): in the drop-down list, select ISO 5393.
Scheduling by time: add/select/delete the scheduling.
Do one of the following:
Click Add icon (
) to add a new scheduling. In the Add Scheduling dialog box, enter the details related to the new scheduling. The Type is set to Time.
Then, click Save.
Click Search icon (
) to select a scheduling already configured. In the Scheduling workspace, select the necessary scheduling. Only the Scheduling by time are shown.
Then, click Apply.
Click Delete icon (
) to delete the selected scheduling.
ToolsNet 8
Scheduling by tool usage: add/select/delete the scheduling.
Do one of the following:
Click Add icon (
) to add a new scheduling. In the Add Scheduling dialog box, enter the details related to the new scheduling. The Type is set to Tool usage counter.
Then, click Save.
Click Search icon (
) to select a scheduling already configured. In the Scheduling workspace, select the necessary scheduling. Only the Scheduling by tool usage are shown.
Then, click Apply.
Click Delete icon (
) to delete the selected scheduling.
Scheduling by SPC failure: enabling this check, the inspection expires if an SPC linked to the Tool fails in production.
Parameters
Number of samples: type the number of tightenings to be done.
By default, the number of samples is 25.
Tightening direction (*): select CW (clockwise direction) or CCW (counterclockwise direction).
Measurement unit (*): select the measuring unit for the inspection.
The default measurement unit is defined both in the Application settings and in the Personal settings.
Number of free round: type the number of free round the power tool must do before starting the test.
Upper Test Torque Level
Upper torque (*): type the torque target for the upper torque test. By default this value is the maximum torque of the tool.
Measure angle from: from the drop-down list, select between:
One step: the measurement of the angle starts as soon as the Final monitoring torque value is reached.
Second step: the measurement of the angle starts in the second step, when the Final angle monitoring torque value is reached.
Starting second step: the measurement of the angle starts at the starting of the second step.
This parameter is available only for power tools.
Final angle monitoring torque (*): it specifies the torque value from which the angle measurement starts.
For the older products, this item is indicated as Start final angle.
Two different definition types are available:
Value in N·m
Percentage value of target torque
Click either the right or the left arrow to change the view of the final angle monitoring torque.
Hard/soft joint angle (*): type the angle value for the definition of the hard/soft joint.
The definition of the joint can be given as follows:
Hard and soft joint angle in degrees
High and low torque rate in Nm/rev
Click either the right or the left arrow to change the view of the angle values.
Lower Test Torque Level
Lower torque (*): type the torque target for the lower torque test. By default this value is the maximum torque of the tool.
Measure angle from: from the drop-down list, select between:
One step: the measurement of the angle starts as soon as the Final monitoring torque value is reached.
Second step: the measurement of the angle starts in the second step, when the Final angle monitoring torque value is reached.
Starting second step: the measurement of the angle starts at the starting of the second step.
This parameter is available only for power tools.
Final angle monitoring torque (*): it specifies the torque value from which the angle measurement starts.
For the older products, this item is indicated as Start final angle.
Two different definition types are available:
Value in Nm
Percentage value of target torque
Click either the right or the left arrow to change the view of the final angle monitoring torque.
Hard/soft joint angle (*): type the angle value for the definition of the hard/soft joint.
The definition of the joint can be given as follows:
Hard and soft joint angle in degrees
High and low torque rate in Nm/rev
Click either the right or the left arrow to change the view of the angle values.
Operator guidance
Picture: click the icon to upload an image (max 5 MB) or a video (max 10 MB). This image is sent to STpad/STpalm/STbench.
Instructions: type text instructions to guide the operator in the inspection run.
Verification code: type the verification code that must be entered or scanned when the inspection is run. This field is case-sensitive.
Verification code description: to guide the operator, type the description of the verification code dialog box that is displayed when the inspection is run.
Assignable causes/Corrective action
Assignable cause: add/select an assignable cause. Do the following:
Click Add icon (
) to add a new assignable cause. In the Add selectable dialog box, enter the details related to the new assignable causes.
Then, click Save.
Click Search icon (
) to select an assignable cause already configured. In the Selectable workspace, select the necessary assignable cause. The displayed items are all the available assignable causes filtered from the selectable list.
Then, click Apply.
Optional: click the Optional switch to do the test without selecting the assignable cause.
Allow manual input: click the allow manual input switch to enable the possibility to add manually a value. This value is saved only for the inspection, it is not added to the assignable cause.
Corrective action: add/select an assignable cause. Do the following:
Click Add icon (
) to add a new corrective action. In the Add selectable dialog box, enter the details related to the new corrective action.
Then, click Save.
Click Search icon (
) to select a corrective action already configured. In the Selectable workspace, select the necessary corrective action. The displayed items are all the available corrective action filtered from the selectable list.
Then, click Apply.
Optional: click the Optional switch to do the test without selecting the corrective action.
Allow manual input: click the allow manual input switch to enable the possibility to add manually a value. This value is saved only for the inspection, it is not added to the corrective action.
Items marked with an asterisk (*) are required.
ISO 6789:2003 parameters
Name (*): type the name of the inspection.
Barcode identifier (*): it identifies the inspection. If left blank, the identifier corresponds to the inspection name. When a barcode is scanned on the measuring device, the matching inspections are sent to the device.
Enable barcode regex: click the switch to enable the barcode regex feature. For more information, refer to Barcode regex.
Type: select “Tool check” from the drop down list.
Tool to inspect (*): add/select the tool to inspect.
Do one of the following:
Click Add icon (
) to add a new tool to inspect. In the Add Tool dialog box, enter the details related to the tool to inspect.
Then, click Save.
Click Search icon (
) to select a tool already configured. In the Tools workspace, select the necessary tool.
Then, click Apply.
Tool model: model of the selected tool. This item is automatically filled in after selecting the tool.
Location: location of the tool. This item is automatically filled in after selecting the tool.
Method (*): in the drop-down list, select ISO 6789:2003.
Scheduling by time: add/select/delete the scheduling.
Do one of the following:
Click Add icon (
) to add a new scheduling. In the Add Scheduling dialog box, enter the details related to the new scheduling. The Type is set to Time.
Then, click Save.
Click Search icon (
) to select a scheduling already configured. In the Scheduling workspace, select the necessary scheduling. Only the Scheduling by time are shown.
Then, click Apply.
Click Delete icon (
) to delete the selected scheduling.
ToolsNet 8
Scheduling by tool usage: add/select/delete the scheduling.
Do one of the following:
Click Add icon (
) to add a new scheduling. In the Add Scheduling dialog box, enter the details related to the new scheduling. The Type is set to Tool usage counter.
Then, click Save.
Click Search icon (
) to select a scheduling already configured. In the Scheduling workspace, select the necessary scheduling. Only the Scheduling by tool usage are shown.
Then, click Apply.
Click Delete icon (
) to delete the selected scheduling.
Scheduling by SPC failure: enabling this check, the inspection expires if an SPC linked to the Tool fails in production.
Parameters
ISO 6789 type: type of wrench defined in ISO 6789 standard.
The wrench type is defined in the configuration of the tool model.
ISO 6789 class: class of wrench defined in ISO 6789 standard.
The wrench class is defined in the configuration of the tool model.
Number of samples: type the number of tightenings to be done.
Tightening direction (*): select one of the following options:
CW: clockwise direction.
CCW: counterclockwise direction.
Measurement unit (*): select the measuring unit for the inspection.
The default measurement unit is defined in the Application settings and in the Personal settings.
Test Points
Test points: values of the test points.
They are calculated from the maximum torque of the selected tool as indicated in the ISO 6789 standard.
The test points can be given as follows:
Torque target and torque deviation
Lower limit (LSL) and upper limit (USL)
Percentage of maximum torque and torque deviation
Click either the right or the left arrow to change the view of the test points.
Operator guidance
Picture: click the icon to upload an image (max 5 MB) or a video (max 10 MB). This image is sent to STpad/STpalm/STbench.
Instructions: type text instructions to guide the operator in the inspection run.
Verification code: type the verification code that must be entered or scanned when the inspection is run. This field is case-sensitive.
Verification code description: to guide the operator, type the description of the verification code dialog box that is displayed when the inspection is run.
Assignable causes/Corrective action
Assignable cause: add/select an assignable cause. Do the following:
Click Add icon (
) to add a new assignable cause. In the Add selectable dialog box, enter the details related to the new assignable causes.
Then, click Save.
Click Search icon (
) to select an assignable cause already configured. In the Selectable workspace, select the necessary assignable cause. The displayed items are all the available assignable causes filtered from the selectable list.
Then, click Apply.
Optional: click the Optional switch to do the test without selecting the assignable cause.
Allow manual input: click the allow manual input switch to enable the possibility to add manually a value. This value is saved only for the inspection, it is not added to the assignable cause.
Corrective action: add/select an assignable cause. Do the following:
Click Add icon (
) to add a new corrective action. In the Add selectable dialog box, enter the details related to the new corrective action.
Then, click Save.
Click Search icon (
) to select a corrective action already configured. In the Selectable workspace, select the necessary corrective action. The displayed items are all the available corrective action filtered from the selectable list.
Then, click Apply.
Optional: click the Optional switch to do the test without selecting the corrective action.
Allow manual input: click the allow manual input switch to enable the possibility to add manually a value. This value is saved only for the inspection, it is not added to the corrective action.
Items marked with an asterisk (*) are required.
ISO 6789:2017 parameters
This inspection is supported by STbench and STpad starting from firmware version 04.01x.
Name (*): type the name of the inspection.
Barcode identifier (*): it identifies the inspection. If left blank, the identifier corresponds to the inspection name. When a barcode is scanned on the measuring device, the matching inspections are sent to the device.
Enable barcode regex: click the switch to enable the barcode regex feature. For more information, refer to Barcode regex.
Type: select Tool check from the drop down list.
Tool to inspect (*): add/select the tool to inspect.
Do one of the following:
Click Add icon (
) to add a new tool to inspect.
In the Add Tool dialog box, enter the details related to the tool to inspect.
Then, click Save.Click Search icon (
) to select a tool already configured.
In the Tools workspace, select the necessary tool.
Then, click Apply.
Tool model: model of the selected tool. This item is automatically filled in after selecting the tool.
Location: location of the tool. This item is automatically filled in after selecting the tool.
Method (*): in the drop-down list, select ISO 6789:2017.
Scheduling by time: add/select/delete the scheduling.
Do one of the following:
Click Add icon (
) to add a new scheduling.
In the Add Scheduling dialog box, enter the details related to the new scheduling. The Type is set to Time.
Then, click Save.Click Search icon (
) to select a scheduling already configured.
In the Scheduling workspace, select the necessary scheduling. Only the Scheduling by time are shown.
Then, click Apply.Click Delete icon (
) to delete the selected scheduling.
ToolsNet 8
Scheduling by tool usage: add/select/delete the scheduling.
Do one of the following:
Click Add icon (
) to add a new scheduling.
In the Add Scheduling dialog box, enter the details related to the new scheduling. The Type is set to Tool usage counter.
Then, click Save.Click Search icon (
) to select a scheduling already configured.
In the Scheduling workspace, select the necessary scheduling. Only the Scheduling by tool usage are shown.
Then, click Apply.Click Delete icon (
) to delete the selected scheduling.
Scheduling by SPC failure: enabling this check, the inspection expires if an SPC linked to the Tool fails in production.
Parameters
ISO 6789 type: type of wrench defined in ISO 6789 standard. The wrench type is defined in the configuration of the tool model.
ISO 6789 class: wrench class defined in ISO 6789 standard. The wrench class is defined in the configuration of the tool model.
Number of samples: type the number of tightenings to be done.
Tightening direction (*): select one of the following options:
CW: clockwise direction.
CCW: counterclockwise direction.
Measurement unit (*): select the measuring unit for the inspection.
The default measurement unit is defined in the Application settings and in the Personal settings.as: type the expected measurement error.
W': type the expected relative uncertainty error.
Disable manual insert: by enabling this switch, the wrench torque readings are automatically populated with the Target torque value of the test. By disabling the switch, the wrench torque readings must be typed manually.
Available only for Type I wrenches.Relaxation time: in case of wrenches that do not save the torque peak, type a value greater than the mechanical relaxation of the wrench. In case of wrenches that do save the torque peak, leave this parameter at 0.
The maximum value is 5 s. Available only for Type I wrenches.End cycle time: if Relaxation time = 0, the End cycle time starts when the torque goes and remains below the Cycle complete for the given time. If Relaxation time > 0, the End cycle time starts when the Relaxation time expires.
The default value is 0.4 s. Available only for Type I wrenches.Preload: click on the switch to enable/disable the preload measurements.
The Preload switch is enabled or disabled by default, according to the ISO 6789:2017 parameters configured in the Application Settings.
Test Points
Test points: values of the test points.
They are calculated from the maximum torque of the selected tool as indicated in the ISO 6789:2017 standard.
The test points can be given as follows:Torque target and torque deviation
Lower limit (LSL) and upper limit (USL)
Percentage of maximum torque and torque deviation
Click either the right or the left arrow to change the view of the test points.
Operator guidance
Picture: click the icon to upload an image (max 5 MB) or a video (max 10 MB). This image is sent to STpad/STpalm/STbench.
Instructions: type text instructions to guide the operator in the inspection run.
Verification code: type the verification code that must be entered or scanned when the inspection is run. This field is case-sensitive.
Verification code description: to guide the operator, type the description of the verification code dialog box that is displayed when the inspection is run.
Assignable causes/Corrective action
Assignable cause: add/select an assignable cause. Do the following:
Click Add icon (
) to add a new assignable cause.
In the Add selectable dialog box, enter the details related to the new assignable causes.
Then, click Save.Click Search icon (
) to select an assignable cause already configured.
In the Selectable workspace, select the necessary assignable cause. The displayed items are all the available assignable causes filtered from the selectable list.
Then, click Apply.
Optional: click the Optional switch to do the test without selecting the assignable cause.
Allow manual input: click the allow manual input switch to enable the possibility to add manually a value. This value is saved only for the inspection, it is not added to the assignable cause.
Corrective action: add/select an assignable cause. Do the following:
Click Add icon (
) to add a new corrective action.
In the Add selectable dialog box, enter the details related to the new corrective action.
Then, click Save.Click Search icon (
) to select a corrective action already configured.
In the Selectable workspace, select the necessary corrective action. The displayed items are all the available corrective action filtered from the selectable list.
Then, click Apply.
Optional: click the Optional switch to do the test without selecting the corrective action.
Allow manual input: click the allow manual input switch to enable the possibility to add manually a value. This value is saved only for the inspection, it is not added to the corrective action.
Items marked with an asterisk (*) are required.
Tool calibration parameters
Name (*): type the name of the inspection.
Barcode identifier (*): it identifies the inspection. If left blank, the identifier corresponds to the inspection name. When a barcode is scanned on the measuring device, the matching inspections are sent to the device.
Enable barcode regex: click the switch to enable the barcode regex feature. For more information, refer to Barcode regex.
Type: select Tool check from the drop down list.
Tool to inspect (*): add/select the tool to inspect.
Do one of the following:
Click Add icon (
) to add a new tool to inspect. In the Add Tool dialog box, enter the details related to the tool to inspect. Then, click Save.
Click the Search icon (
) to select a tool already configured. In the Tools workspace, select the necessary tool. Then, click Apply.
Tool model: model of the selected tool. This item is automatically filled in after selecting the tool.
Location: location of the selected tool. This item is automatically filled in after selecting the tool.
Method (*): in the drop-down list, select Tool calibration.
This method is available only for Power tools and Pulse tools.
Scheduling by time: add/select/delete the scheduling.
Do one of the following:
Click Add icon (
) to add a new scheduling.
In the Add Scheduling dialog box, enter the details related to the new scheduling. The Type is set to Time.
Then, click Save.Click Search icon (
) to select a scheduling already configured.
In the Scheduling workspace, select the necessary scheduling. Only the Scheduling by time are shown.
Then, click Apply.Click Delete icon (
) to delete the selected scheduling.
ToolsNet 8
Scheduling by tool usage: add/select/delete the scheduling.
Do one of the following:Click Add icon (
) to add a new scheduling.
In the Add Scheduling dialog box, enter the details related to the new scheduling. The Type is set to Tool usage counter.
Then, click Save.Click Search icon (
) to select a scheduling already configured.
In the Scheduling workspace, select the necessary scheduling. Only the Scheduling by tool usage are shown.
Then, click Apply.Click Delete icon (
) to delete the selected scheduling.
Scheduling by SPC failure: enabling this check, the inspection expires if an SPC linked to the Tool fails in production.
Parameters
Strategy (*): select Direct driven for Power tools, choose between Pulse and ACTA Pulse for Pulse tools.
Joint (*): in the box, select the necessary joint.
To add a new joint, click Add icon ( ).
In the Add joint dialog box, enter the details related to new joint.
Then, click Save.
This item is enabled only for Power tools and if Get PSET from controller check box is not selected.
Get PSET from controller: select this option to use the Joint configuration on the controller.
This option is available only for Power tools and Power Focus 3000/4000 controller unit.
Controller unit: add/select the controller unit.
Do one of the following:Click Add icon (
) to add a new controller unit.
In the Add Controller unit dialog box, enter the details related to the new controller unit.
Then, click Save.Click Search icon (
) to select a controller unit already configured.
In the Controller units workspace, select the necessary controller unit.
Then, click Apply.
Use linked controller unit: select this option to use the Controller configuration selected in the Tool definition.
This option is available only for tools having a controller or connectivity data set.
Controller unit type: controller unit type selected in the Tool or in the Controller definition.
Number of samples: type the number of tightenings to be done.
Measurement unit (*): select the measuring unit for the inspection.
The default measurement unit is defined both in the Application settings or Personal settings.Required transducer: add/select/delete the transducer.
Do one of the following:Click Add icon (
) to add a new transducer.
In the Add Transducer dialog box, enter the details related to the new transducer.
Then, click Save.Click Search icon (
) to select a transducer already configured.
In the Transducers workspace, select the necessary transducer.
Then, click Apply.Click Delete icon (
) to delete the selected transducer.
Tolerance torque (*): type the percentage of the torque tolerance limits.
Torque correction coefficient (*): type the coefficient for torque correction.
The default value is 1. Available only for Pulse strategy.Use tool model torque correction: by enabling this switch, the torque correction coefficient of the tool model is used.
Available only for Pulse strategy, provided that the tool model has a correction coefficient.Filter frequency (*): type the value of the filter frequency.
The filter frequency ranges from 100 Hz to 4000 Hz. Default value 850 Hz. Available only for Pulse tools.Measure delay time (*): type the value of the measure delay time.
The measure delay time ranges from 0 s to 5 s. Available only for ACTA Pulse strategy.Reset time (*): type the value of the reset time. During this interval, the torque trace is not analyzed.
The reset time ranges from 0 s to 5 s. Available only for ACTA Pulse strategy.End cycle time (*): when the torque goes and remains below the Cycle Complete for the given timeout, the test ends.
Available only for Pulse tools.Spindle number: type the number of the spindle to use during the calibration.
This option is available only for Power tools and if Power MACS is selected.Calibration mode: type the calibration mode to use.
This option is available only for Power tools and if Power MACS is selected.Calibration torque: type the torque value for the calibration.
This option is available only for Power tools and if Power MACS is selected and Calibration mode is set to 0.Tolerance angle: type the value in degree of the angle tolerance limits.
This option is available only for Power tools, and it is not available if Power MACS is selected and Calibration mode is set to a value different from 0.
Simulated trace
Simulated trace is displayed only if a joint linked to a simulated trace has been selected during the inspection definition.
Trace (*): name of trace linked to the selected joint.
Chart of the simulated trace.
Operator guidance
Picture: click the icon to upload an image (max 5 MB) or a video (max 10 MB). This image is sent to STpad/STpalm/STbench.
Instructions: type text instructions to guide the operator in the inspection run.
Verification code: type the verification code that must be entered or scanned when the inspection is run. This field is case-sensitive.
Verification code description: to guide the operator, type the description of the verification code dialog box that is displayed when the inspection is run.
Assignable causes/Corrective action
Assignable cause: add/select an assignable cause. Do the following:
Click Add icon (
) to add a new assignable cause.
In the Add selectable dialog box, enter the details related to the new assignable causes.
Then, click Save.Click Search icon (
) to select an assignable cause already configured.
In the Selectable workspace, select the necessary assignable cause. The displayed items are all the available assignable causes filtered from the selectable list.
Then, click Apply.
Optional: click the Optional switch to do the test without selecting the assignable cause.
Allow manual input: click the allow manual input switch to enable the possibility to add manually a value. This value is saved only for the inspection, it is not added to the assignable cause.
Corrective action: add/select an assignable cause. Do the following:
Click Add icon (
) to add a new corrective action.
In the Add selectable dialog box, enter the details related to the new corrective action.
Then, click Save.Click Search icon (
) to select a corrective action already configured.
In the Selectable workspace, select the necessary corrective action. The displayed items are all the available corrective action filtered from the selectable list.
Then, click Apply.
Optional: click the Optional switch to do the test without selecting the corrective action.
Allow manual input: click the allow manual input switch to enable the possibility to add manually a value. This value is saved only for the inspection, it is not added to the corrective action.
Items marked with an asterisk (*) are required.
VDI/VDE 2645-2 parameters
VDI/VDE 2645-2 is implemented only for motorized tools, continuously rotating.
Name (*): type the name of the inspection.
Barcode identifier (*): it identifies the inspection. If left blank, the identifier corresponds to the inspection name. When a barcode is scanned on the measuring device, the matching inspections are sent to the device.
Enable barcode regex: click the switch to enable the barcode regex feature. For more information, refer to Barcode regex.
Type: select Tool check from the drop down list..
Tool to inspect (*): add/Select the tool to inspect.
Do one of the following:
Click Add icon (
) to add a new tool to inspect. In the Add tool dialog box, enter the details related to the tool to inspect.
Then, click Save.
Click Search icon (
) to select a tool already configured.In the Tools workspace, select the necessary tool.
Then, click Apply.
Tool model: model of the selected tool. This item is automatically filled in after selecting the tool.
Location: location of the tool. This item is automatically filled in after selecting the tool.
Method (*): in the Method drop-down list, select VDI/VDE2645-2.
Scheduling by time: add/select/delete the scheduling.
Do one of the following:
Click Add icon (
) to add a new scheduling. In the Add Scheduling dialog box, enter the details related to the new scheduling. The Type is set to Time.
Then, click Save.
Click Search icon (
) to select a scheduling already configured. In the Scheduling workspace, select the necessary scheduling. Only the Scheduling by time are shown.
Then, click Apply.
Click Delete icon (
) to delete the selected scheduling.
ToolsNet 8
Scheduling by tool usage: add/select/delete the scheduling.
Do one of the following:
Click Add icon (
) to add a new scheduling. In the Add Scheduling dialog box, enter the details related to the new scheduling. The Type is set to Tool usage counter.
Then, click Save.
Click Search icon (
) to select a scheduling already configured. In the Scheduling workspace, select the necessary scheduling. Only the Scheduling by tool usage are shown.
Then, click Apply.
Click Delete icon (
) to delete the selected scheduling.
Scheduling by SPC failure: enabling this check, the inspection expires if an SPC linked to the Tool fails in production.
Parameters
Control system (*): control system of the tool model. The default value is the control system defined in the tool model configuration. To change the default value, select an option in the Control system drop down list.
Control variable (*): variable to control during test. The default value is torque.
The torque & angle option is available only for tool models that measure both torque and angle.
Torque stages (*): number of steps to do during the test.
Target source (*): select one of the following options: Position based or Tool based.
For each method, the standard VDI/VDE 2645-2 defines different test points.
Condition and method: the final combination of General Condition and Method chosen for the inspection according the VDI/VDE 2645-2 naming convention. This is a read-only value.
Number of samples: type the number of tightenings to do.
Tightening direction (*): select one of the following options: CW (clockwise direction) or CCW (counterclockwise direction).
If the target source is Position based, this field is shown in the test point configuration.
Measurement unit (*): select the measuring unit for the inspection. The default measurement unit is defined both in the Application settings and in the Personal settings.
Cm: minimum value of Cm for the torque. This is a read-only value.
Cmk: minimum value of Cmk for the torque. This is a read-only value.
Change recommended tolerance: click the switch to change the tolerance value of the test points of the selected method.
If the Target source is set to Tool based:
Test point – torque:
% of operating range: target torque, expressed as percentage of the tool operating range.
The value is set by the VDI/VDE 2645-2 standard. This is a read-only value.
Torque tolerance: tolerance of the torque, express in percentage. The default value is set by the standard, but enabling the "Change recommended tolerance" switch, this value is editable.
Final angle monitoring torque: the final angle monitoring torque specifies the torque value from which the angle measurement starts. This value is express as percentage of the tool operating range.
For the older products, this item is indicated as Start final angle.
Angle: value of the target angle. The value is set by the VDI/VDE 2645-2 standard. This is a read-only value.
Test point – angle
Angle target: value of the target angle, expressed in degree.
Angle tolerance: tolerance of the angle, expressed in degrees.
Final angle monitoring torque: the final angle monitoring torque specifies the torque value from which the angle measurement starts. This value is expressed as percentage of the tool operating range.
For the older products, this item is indicated as Start final angle.
% maximum torque: torque value expressed as percentage of the maximum torque of the tool model.
If the Target source is set to Position based:
Test point – torque:
Joint (*): in the Joints box, select the necessary joint.
To add a new joint, click Add icon (
). In the Add joint dialog box, enter the details related to new joint.
Then, click Save.
Torque target: value of the target torque.
Torque tolerance: value of torque tolerance.
Tightening direction: tightening direction defined in the joint configuration.
Final angle monitoring torque: the final angle monitoring torque specifies the torque value from which the angle measurement starts.
For the older products, this item is indicated as Start final angle.
Angle: value of the target angle.
Test point – angle
Joint (*): in the Joints box, select the necessary joint.
To add a new joint, click Add icon (
).In the Add joint dialog box, enter the details related to new joint.
Then, click Save.
Angle target: value of the target angle.
Angle tolerance: value of the angle tolerance.
Tightening direction: tightening direction defined in the joint configuration.
Measure angle from: from the drop-down list, select between:
One step: the measurement of the angle starts as soon as the Final monitoring torque value is reached.
Second step: the measurement of the angle starts in the second step, when the Final angle monitoring torque value is reached.
Starting second step: the measurement of the angle starts at the starting of the second step.
This parameter is available only for power tools.
Final angle monitoring torque: the final angle monitoring torque specifies the torque value from which the angle measurement starts.
For the older products, this item is indicated as Start final angle.
Torque: value of torque.
On the right of the test point name, click the switch to enable or disable the test point.
Operation guidance
Picture: click the icon to upload an image (max 5 MB) or a video (max 10 MB). This image is sent to STpad/STpalm/STbench.
Instructions: type text instructions to guide the operator in the inspection run.
Verification code: type the verification code that must be entered or scanned when the inspection is run. This field is case-sensitive.
Verification code description: to guide the operator, type the description of the verification code dialog box that is displayed when the inspection is run.
Assignable causes/Corrective action
Assignable cause: add/select an assignable cause. Do the following:
Click Add icon (
) to add a new assignable cause. In the Add selectable dialog box, enter the details related to the new assignable causes.
Then, click Save.
Click Search icon (
) to select an assignable cause already configured. In the Selectable workspace, select the necessary assignable cause. The displayed items are all the available assignable causes filtered from the selectable list.
Then, click Apply.
Optional: click the Optional switch to do the test without selecting the assignable cause.
Allow manual input: click the allow manual input switch to enable the possibility to add manually a value. This value is saved only for the inspection, it is not added to the assignable cause.
Corrective action: add/select an assignable cause. Do the following:
Click Add icon (
) to add a new corrective action. In the Add selectable dialog box, enter the details related to the new corrective action.
Then, click Save.
Click Search icon (
) to select a corrective action already configured. In the Selectable workspace, select the necessary corrective action. The displayed items are all the available corrective action filtered from the selectable list.
Then, click Apply.
Optional: click the Optional switch to do the test without selecting the corrective action.
Allow manual input: click the allow manual input switch to enable the possibility to add manually a value. This value is saved only for the inspection, it is not added to the corrective action.
Items marked with an asterisk (*) are required.
JJF 1610:2017 parameters
Name (*): type the name of the inspection.
Barcode identifier (*): it identifies the inspection. If left blank, the identifier corresponds to the inspection name. When a barcode is scanned on the measuring device, the matching inspections are sent to the device.
Enable barcode regex: click the switch to enable the barcode regex feature. For more information, refer to Barcode regex.
Type: select Tool check in the drop down list.
Tool to inspect (*): add/select the tool to inspect.
Do one of the following:
Click Add icon (
) to add a new tool to inspect. In the Add Tool dialog box, enter the details related to the tool to inspect.
Then, click Save.
Click Search icon (
) to select a tool already configured. In the Tools workspace, select the necessary tool.
Then, click Apply.
Tool model: model of the selected tool. This item is automatically filled in after selecting the tool.
Location: location of the tool. This item is automatically filled in after selecting the tool.
Method (*): in the drop-down list, select JJF 1610:2017.
Scheduling by time: add/select/delete the scheduling.
Do one of the following:
Click Add icon (
) to add a new scheduling. In the Add Scheduling dialog box, enter the details related to the new scheduling. The Type is set to Time.
Then, click Save.
Click Search icon (
) to select a scheduling already configured. In the Scheduling workspace, select the necessary scheduling. Only the Scheduling by time are shown.
Then, click Apply.
Click Delete icon (
) to delete the selected scheduling.
ToolsNet 8
Scheduling by tool usage: add/select/delete the scheduling.
Do one of the following:
Click Add icon (
) to add a new scheduling. In the Add Scheduling dialog box, enter the details related to the new scheduling. The Type is set to Tool usage counter.
Then, click Save.
Click Search icon (
) to select a scheduling already configured. In the Scheduling workspace, select the necessary scheduling. Only the Scheduling by tool usage are shown.
Then, click Apply.
Click Delete icon (
) to delete the selected scheduling.
Scheduling by SPC failed: by enabling this switch, the inspection expires if an SPC linked to the Tool fails in production.
Parameters
Number of samples: type the number of tightenings to be done.
Tightening direction (*): select one of the following items:
CW: clockwise direction.
CCW: counterclockwise direction.
Measurement unit (*): select the measuring unit for the inspection.
The default measurement unit is defined both in the Application settings and in the Personal settings.
Number of free rounds (*): type the number of free rounds to be done.
Filter frequency (*): Type the filter frequency value.
By default, the filter frequency is set to 500 Hz.
Preload: click on the switch to enable/disable the preload measurements.
The Preload switch is enabled or disabled by default, according to the JJF 1610:2017 parameters configured in the Application Settings.
Calibration point 1
Torque target (*): this parameter is defined in the JJF 1610:2017 standard. The default value of the target torque is equal to the tool minimum capacity.
Measure angle from: from the drop-down list, select between:
One step: the measurement of the angle starts as soon as the Final monitoring torque value is reached.
Second step: the measurement of the angle starts in the second step, when the Final angle monitoring torque value is reached.
Starting second step: the measurement of the angle starts at the starting of the second step.
This parameter is available only for power tools.
Final angle monitoring torque (*): it specifies the torque value from which the angle measurement starts.
The default value of the final angle monitoring is half of the target torque.
Hard/soft joint angle (*): type the angle value for the definition of the hard/soft joint.
The definition of the joint can be given as follows:
Hard and soft joint angle in degrees
High and low torque rate in Nm/rev
The default value of the hard joint angle is equal to 15.0 °; the default value of the soft joint angle is equal to 360.0 °.
Calibration point 2 and Calibration point 3 have the same structure of the Calibration point 1, only the target torque changes.
In Calibration point 2, the target torque is set to the 60% of the tool maximum capacity.
In Calibration point 3, the target torque is set to the 100% of the tool maximum capacity.
To define only Calibration point 1 phase of the inspection, click on the Included switch of Calibration point 3 to disable the third phase of the inspection. Then, click on the Included switch of Calibration point 2 to disable the second phase of the inspection.
Operator guidance
Picture: click the icon to upload an image (max 5 MB) or a video (max 10 MB). This image is sent to STpad/STpalm/STbench.
Instructions: type text instructions to guide the operator in the inspection run.
Verification code: type the verification code that must be entered or scanned when the inspection is run. This field is case-sensitive.
Verification code description: to guide the operator, type the description of the verification code dialog box that is displayed when the inspection is run.
Assignable causes/Corrective actions
Assignable cause: add/select an assignable cause. Do the following:
Click Add icon (
) to add a new assignable cause. In the Add selectable dialog box, enter the details related to the new assignable causes.
Then, click Save.
Click Search icon (
) to select an assignable cause already configured. In the Selectable workspace, select the necessary assignable cause. The displayed items are all the available assignable causes filtered from the selectable list.
Then, click Apply.
Optional: click the Optional switch to do the test without selecting the assignable cause.
Allow manual input: click the Allow manual input switch to enable the possibility to add manually a value. This value is saved only for the inspection, it is not added to the assignable cause.
Corrective action: add/select an assignable cause. Do the following:
Click Add icon (
) to add a new corrective action. In the Add selectable dialog box, enter the details related to the new corrective action.
Then, click Save.
Click Search icon (
) to select a corrective action already configured. In the Selectable workspace, select the necessary corrective action. The displayed items are all the available corrective action filtered from the selectable list.
Then, click Apply.
Optional: click the Optional switch to do the test without selecting the corrective action.
Allow manual input: click the Allow manual input switch to enable the possibility to add manually a value. This value is saved only for the inspection, it is not added to the corrective action.
Items marked with an asterisk (*) are required.
Joint check inspection
Cp/Cpk parameters
Name (*): Type the name of the inspection.
Barcode identifier (*): it identifies the inspection. If left blank, the identifier corresponds to the inspection name. When a barcode is scanned on the measuring device, the matching inspections are sent to the device.
Enable barcode regex: click the switch to enable the barcode regex feature. For more information, refer to Barcode regex.
Type: select Joint check from the drop down list.
Joint to inspect (*): Add/Select the joint to inspect.
Do one of the following:
Click Add icon (
) to add a new joint to inspect. In the Add joint dialog box, enter the details related to the joint to inspect.
Then, click Save.
Click Search icon (
) to select a joint already configured.In the Joints workspace, select the necessary joint.
Then, click Apply.
Location: location of the joint. This item is automatically filled in after selecting the joint. If necessary, click the Location icon and select the location from the location tree.
Method (*): in the Method drop-down list, select Cp/Cpk.
Scheduling: Add/Select/Delete the scheduling.
Do one of the following:
Click Add icon (
) to add a new scheduling.In the Add scheduling dialog box, enter the details related to the new scheduling.
Then, click Save.
Click Search icon (
) to select a scheduling already configured.In the Scheduling workspace, select the necessary scheduling.
Then, click Apply.
Click Delete icon (
) to delete the selected scheduling.
Parameters
Number of samples: type the number of tightenings to be done.
Tightening direction (*): the tightening direction depends on the joint configuration. This is a read-only value.
Measurement unit (*): select the measuring unit for the inspection. The default measurement unit is defined both in the Application settings and in the Personal settings.
Required transducer: Add/Select/Delete the transducer.
Do one of the following:
Click Add icon (
) to add a new transducer. In the Add transducer dialog box, enter the details related to the new transducer.
Then, click Save.
Click Search icon (
) to select a transducer already configured.In the Transducers workspace, select the necessary transducer.
Then, click Apply.
Click Delete icon (
) to delete the selected transducer.
Torque
Torque values (*): type the torque target and the torque limits.
The torque values can be given as follows:
Torque target and torque tolerance
Lower limit (LSL) and upper limit (USL)
Click either the right or the left arrow to change the view of the torque values.
Cp min (*): type the minimum value of Cp.
Cpk min (*): type the minimum value of Cpk.
Advanced parameters
Enter the required parameters. Refer to the paragraph Advanced parameters for the definition of all the parameters.
Operator guidance
Picture: click the icon to upload an image (max 5 MB) or a video (max 10 MB). This image is sent to STpad/STpalm/STbench.
Instructions: type text instructions to guide the operator in the inspection run.
Verification code: type the verification code that must be entered or scanned when the inspection is run. This field is case-sensitive.
Verification code description: to guide the operator, type the description of the verification code dialog box that is displayed when the inspection is run.
Assignable causes/Corrective action
Assignable cause: add/select an assignable cause. Do the following:
Click Add icon (
) to add a new assignable cause. In the Add selectable dialog box, enter the details related to the new assignable causes.
Then, click Save.
Click Search icon (
) to select an assignable cause already configured. In the Selectable workspace, select the necessary assignable cause. The displayed items are all the available assignable causes filtered from the selectable list.
Then, click Apply.
Optional: click the Optional switch to do the test without selecting the assignable cause.
Allow manual input: click the allow manual input switch to enable the possibility to add manually a value. This value is saved only for the inspection, it is not added to the assignable cause.
Corrective action: add/select an assignable cause. Do the following:
Click Add icon (
) to add a new corrective action. In the Add selectable dialog box, enter the details related to the new corrective action.
Then, click Save.
Click Search icon (
) to select a corrective action already configured. In the Selectable workspace, select the necessary corrective action. The displayed items are all the available corrective action filtered from the selectable list.
Then, click Apply.
Optional: click the Optional switch to do the test without selecting the corrective action.
Allow manual input: click the allow manual input switch to enable the possibility to add manually a value. This value is saved only for the inspection, it is not added to the corrective action.
Items marked with an asterisk (*) are required.
SPC joint check parameters
Name (*): type the name of the inspection.
Barcode identifier (*): it identifies the inspection. If left blank, the identifier corresponds to the inspection name. When a barcode is scanned on the measuring device, the matching inspections are sent to the device.
Enable barcode regex: click the switch to enable the barcode regex feature. For more information, refer to Barcode regex.
Type: select Joint check from the drop down list.
Joint to inspect (*): Add/Select the joint to inspect.
Do one of the following:
Click Add icon (
) to add a new joint to inspect. In the Add joint dialog box, enter the details related to the joint to inspect.
Then, click Save.
Click Search icon (
) to select a joint already configured.In the Joints workspace, select the necessary joint.
Then, click Apply.
Location: location of the joint. This item is automatically filled in after selecting the joint. If necessary, click the Location icon and select the location from the location tree.
Method (*): in the Method drop-down list, select SPC (joint).
Scheduling: Add/Select/Delete the scheduling.
Do one of the following:
Click Add icon (
) to add a new scheduling.In the Add scheduling dialog box, enter the details related to the new scheduling.
Then, click Save.
Click Search icon (
) to select a scheduling already configured.In the Scheduling workspace, select the necessary scheduling.
Then, click Apply.
Click Delete icon (
) to delete the selected scheduling.
Parameters
Number of samples: type the number of tightenings to be done.
Subgroup size: type the number of tightenings to calculate the statistics.
Subgroup frequency: type the frequency of the averages displayed in the X chart and in the SPC rules. For example:
Subgroup frequency = 1 → all subgroups are considered.
Subgroup frequency = 2 → one subgroup every 2 subgroups is considered.
Subgroup frequency = X → one subgroup every X subgroups is considered.
Tightening direction (*): the tightening direction depends on the joint configuration. This is a read-only value.
Measurement unit (*): select the measuring unit for the inspection. The default measurement unit is defined both in the Application Settings and in the Personal Settings.
Required transducer: Add/Select/Delete the transducer.
Do one of the following:
Click Add icon (
) to add a new transducer. In the Add transducer dialog box, enter the details related to the new transducer.
Then, click Save.
Click Search icon (
) to select a transducer already configured. In the Transducers workspace, select the necessary transducer.
Then, click Apply.
Click Delete icon (
) to delete the selected transducer.
Torque
Torque values (*): type the torque target and the torque limits.
The torque values can be given as follows:
Target torque and torque tolerance
Lower limit (LSL) and upper limit (USL)
Click either the right or the left arrow to change the view of the torque values.
Items marked with an asterisk (*) are required.
Advanced parameters
Enter the required parameters. Refer to the paragraph Advanced parameters for the definition of all the parameters.
Operator guidance
Picture: click the icon to upload an image (max 5 MB) or a video (max 10 MB). This image is sent to STpad/STpalm/STbench.
Instructions: type text instructions to guide the operator in the inspection run.
Verification code: type the verification code that must be entered or scanned when the inspection is run. This field is case-sensitive.
Verification code description: to guide the operator, type the description of the verification code dialog box that is displayed when the inspection is run.
Assignable causes/Corrective action
Assignable cause: add/select an assignable cause. Do the following:
Click Add icon (
) to add a new assignable cause. In the Add selectable dialog box, enter the details related to the new assignable causes.
Then, click Save.
Click Search icon (
) to select an assignable cause already configured. In the Selectable workspace, select the necessary assignable cause. The displayed items are all the available assignable causes filtered from the selectable list.
Then, click Apply.
Optional: click the Optional switch to do the test without selecting the assignable cause.
Allow manual input: click the allow manual input switch to enable the possibility to add manually a value. This value is saved only for the inspection, it is not added to the assignable cause.
Corrective action: add/select an assignable cause. Do the following:
Click Add icon (
) to add a new corrective action. In the Add selectable dialog box, enter the details related to the new corrective action.
Then, click Save.
Click Search icon (
) to select a corrective action already configured. In the Selectable workspace, select the necessary corrective action. The displayed items are all the available corrective action filtered from the selectable list.
Then, click Apply.
Optional: click the Optional switch to do the test without selecting the corrective action.
Allow manual input: click the allow manual input switch to enable the possibility to add manually a value. This value is saved only for the inspection, it is not added to the corrective action.
Items marked with an asterisk (*) are required.
Visual check inspection
Attribute parameters
Name (*): type the name of the inspection.
Barcode identifier (*): it identifies the inspection. If left blank, the identifier corresponds to the inspection name. When a barcode is scanned on the measuring device, the matching inspections are sent to the device.
Enable barcode regex: click the switch to enable the barcode regex feature. For more information, refer to Barcode regex.
Type (*): select Visual check from the drop down list.
Location (*): location of the inspection. Click the Location button and the location. Only Stations or an Assembly parts are allowed
Method (*): in the drop-down list, select Attribute.
Scheduling: add/select/delete the scheduling.
Do one of the following:
Click Add icon (
) to add a new scheduling. In the Add Scheduling dialog box, enter the details related to the new scheduling.
Then, click Save.
Click Search icon (
) to select a scheduling already configured. In the Scheduling workspace, select the necessary scheduling.
Then, click Apply.
Click Delete icon (
) to delete the selected scheduling.
Parameters
Number of sample (*): type the number of test to be done
Max coherent NOKs (*): type the number of accepted NOK results to pass the inspection. The NOK result tolerance can be given as follow:
NOK results / number of sample.
percentage value respect the number of sample.
Attribute list (*): add/select an attribute list. Do the following:
Click Add icon (
) to add a new attribute list. In the Add attribute list dialog box, enter the details related to the new attribute list.
Then, click Save.
Click Search icon (
) to select an attribute list already configured. In the Attribute list workspace, select the necessary attribute list.
Then, click Apply.
Allow manual input: click the allow manual input switch to enable the possibility to add manually a value. This value is saved only for the inspection, it is not added to the attribute list.
The Allow manual input switch available for the attribute list created during the configuration of the inspection.
The Allow manual input switch indicates the value selected in the configuration of the searched attribute list.
Operator guidance
Picture: click the icon to upload an image (max 5 MB) or a video (max 10 MB). This image is sent to STpad/STpalm/STbench.
Instructions: type text instructions to guide the operator in the inspection run.
Verification code: type the verification code that must be entered or scanned when the inspection is run. This field is case-sensitive.
Verification code description: to guide the operator, type the description of the verification code dialog box that is displayed when the inspection is run.
Assignable causes/Corrective action
Assignable cause: add/select an assignable cause. Do the following:
Click Add icon (
) to add a new assignable cause. In the Add selectable dialog box, enter the details related to the new assignable causes.
Then, click Save.
Click Search icon (
) to select an assignable cause already configured. In the Selectable workspace, select the necessary assignable cause. The displayed items are all the available assignable causes filtered from the selectable list.
Then, click Apply.
Optional: click the Optional switch to do the test without selecting the assignable cause.
Allow manual input: click the allow manual input switch to enable the possibility to add manually a value. This value is saved only for the inspection, it is not added to the assignable cause.
Corrective action: add/select an assignable cause. Do the following:
Click Add icon (
) to add a new corrective action. In the Add selectable dialog box, enter the details related to the new corrective action.
Then, click Save.
Click Search icon (
) to select a corrective action already configured. In the Selectable workspace, select the necessary corrective action. The displayed items are all the available corrective action filtered from the selectable list.
Then, click Apply.
Optional: click the Optional switch to do the test without selecting the corrective action.
Allow manual input: click the allow manual input switch to enable the possibility to add manually a value. This value is saved only for the inspection, it is not added to the corrective action.
Items marked with an asterisk (*) are required.
Binary parameters
Name (*): type the name of the inspection.
Barcode identifier (*): it identifies the inspection. If left blank, the identifier corresponds to the inspection name. When a barcode is scanned on the measuring device, the matching inspections are sent to the device.
Enable barcode regex: click the switch to enable the barcode regex feature. For more information, refer to Barcode regex.
Type (*): select "Visual check" drop down list.
Location (*): location of the inspection. Click the Location button and the location. Only Stations or Assembly parts are allowed.
Method (*): in the drop-down list, select the method of the inspection (Binary).
Scheduling: add/select/delete the scheduling.
Do one of the following:
Click Add icon (
) to add a new scheduling. In the Add Scheduling dialog box, enter the details related to the new scheduling.
Then, click Save.
Click Search icon (
) to select a scheduling already configured. In the Scheduling workspace, select the necessary scheduling.
Then, click Apply.
Click Delete icon (
) to delete the selected scheduling.
Parameters
Number of sample (*): type the number of test to be done.
Max coherent NOKs (*): type the number of accepted NOK results to pass the inspection. The NOK result tolerance can be given as follow:
NOK results / number of sample.
percentage value respect the number of sample.
Binary option (*): add/select an binary option. Do the following:
Click Add icon (
) to add a new binary option. In the Add binary option dialog box, enter the details related to the new binary option.
Then, click Save.
Click Search icon (
) to select a binary option already configured. In the Binary option workspace, select the necessary binary option.
Then, click Apply.
Operator guidance
Operator guidance
Picture: click the icon to upload an image (max 5 MB) or a video (max 10 MB). This image is sent to STpad/STpalm/STbench.
Instructions: type text instructions to guide the operator in the inspection run.
Verification code: type the verification code that must be entered or scanned when the inspection is run. This field is case-sensitive.
Verification code description: to guide the operator, type the description of the verification code dialog box that is displayed when the inspection is run.
Assignable causes/Corrective action
Assignable cause: add/select an assignable cause. Do the following:
Click Add icon (
) to add a new assignable cause. In the Add selectable dialog box, enter the details related to the new assignable causes.
Then, click Save.
Click Search icon (
) to select an assignable cause already configured. In the Selectable workspace, select the necessary assignable cause. The displayed items are all the available assignable causes filtered from the selectable list.
Then, click Apply.
Optional: click the Optional switch to do the test without selecting the assignable cause.
Allow manual input: click the allow manual input switch to enable the possibility to add manually a value. This value is saved only for the inspection, it is not added to the assignable cause.
Corrective action: add/select an assignable cause. Do the following:
Click Add icon (
) to add a new corrective action. In the Add selectable dialog box, enter the details related to the new corrective action.
Then, click Save.
Click Search icon (
) to select a corrective action already configured. In the Selectable workspace, select the necessary corrective action. The displayed items are all the available corrective action filtered from the selectable list.
Then, click Apply.
Optional: click the Optional switch to do the test without selecting the corrective action.
Allow manual input: click the allow manual input switch to enable the possibility to add manually a value. This value is saved only for the inspection, it is not added to the corrective action.
Items marked with an asterisk (*) are required.
Instruction parameters
Name (*): type the name of the inspection.
Barcode identifier (*): it identifies the inspection. If left blank, the identifier corresponds to the inspection name. When a barcode is scanned on the measuring device, the matching inspections are sent to the device.
Enable barcode regex: click the switch to enable the barcode regex feature. For more information, refer to Barcode regex.
Type (*): select Visual check from the drop down list.
Location (*): location of the inspection. Click the Location button and the location. Only Stations or an Assembly parts are allowed
Method (*): in the drop-down list, select Instruction.
Scheduling by time: add/select/delete the scheduling.
Do one of the following:
Click Add icon (
) to add a new scheduling. In the Add Scheduling dialog box, enter the details related to the new scheduling.
Then, click Save.
Click Search icon (
) to select a scheduling already configured. In the Scheduling workspace, select the necessary scheduling.
Then, click Apply.
Click Delete icon (
) to delete the selected scheduling.
Operator guidance
Picture: click the icon to upload an image (max 5 MB) or a video (max 10 MB). This image is sent to STpad/STpalm/STbench.
Instructions: type text instructions to guide the operator in the inspection run.
Verification code: type the verification code that must be entered or scanned when the inspection is run. This field is case-sensitive.
Verification code description: to guide the operator, type the description of the verification code dialog box that is displayed when the inspection is run.
Assignable causes/Corrective actions
Assignable cause: add/select an assignable cause. Do the following:
Click Add icon (
) to add a new assignable cause. In the Add selectable dialog box, enter the details related to the new assignable causes.
Then, click Save.
Click Search icon (
) to select an assignable cause already configured. In the Selectable workspace, select the necessary assignable cause. The displayed items are all the available assignable causes filtered from the selectable list.
Then, click Apply.
Optional: click the Optional switch to do the test without selecting the assignable cause.
Allow manual input: click the Allow manual input switch to enable the possibility to add manually a value. This value is saved only for the inspection, it is not added to the assignable cause.
Corrective action: add/select an assignable cause. Do the following:
Click Add icon (
) to add a new corrective action. In the Add selectable dialog box, enter the details related to the new corrective action.
Then, click Save.
Click Search icon (
) to select a corrective action already configured. In the Selectable workspace, select the necessary corrective action. The displayed items are all the available corrective action filtered from the selectable list.
Then, click Apply.
Optional: click the Optional switch to do the test without selecting the corrective action.
Allow manual input: click the Allow manual input switch to enable the possibility to add manually a value. This value is saved only for the inspection, it is not added to the corrective action.
Items marked with an asterisk (*) are required.
Picture parameters
Name (*): type the name of the inspection.
Barcode identifier (*): it identifies the inspection. If left blank, the identifier corresponds to the inspection name. When a barcode is scanned on the measuring device, the matching inspections are sent to the device.
Enable barcode regex: click the switch to enable the barcode regex feature. For more information, refer to Barcode regex.
Type (*): select Visual check from the drop down list.
Location (*): location of the inspection. Click the Location button and the location. Only Stations or an Assembly parts are allowed
Method (*): in the drop-down list, select Picture.
Scheduling by time: add/select/delete the scheduling.
Do one of the following:
Click Add icon (
) to add a new scheduling. In the Add Scheduling dialog box, enter the details related to the new scheduling.
Then, click Save.
Click Search icon (
) to select a scheduling already configured. In the Scheduling workspace, select the necessary scheduling.
Then, click Apply.
Click Delete icon (
) to delete the selected scheduling.
Operator guidance
Picture: click the icon to upload an image (max 5 MB) or a video (max 10 MB). This image is sent to STpad/STpalm/STbench.
Instructions: type text instructions to guide the operator in the inspection run.
Verification code: type the verification code that must be entered or scanned when the inspection is run. This field is case-sensitive.
Verification code description: to guide the operator, type the description of the verification code dialog box that is displayed when the inspection is run.
Assignable causes/Corrective actions
Assignable cause: add/select an assignable cause. Do the following:
Click Add icon (
) to add a new assignable cause. In the Add selectable dialog box, enter the details related to the new assignable causes.
Then, click Save.
Click Search icon (
) to select an assignable cause already configured. In the Selectable workspace, select the necessary assignable cause. The displayed items are all the available assignable causes filtered from the selectable list.
Then, click Apply.
Optional: click the Optional switch to do the test without selecting the assignable cause.
Allow manual input: click the Allow manual input switch to enable the possibility to add manually a value. This value is saved only for the inspection, it is not added to the assignable cause.
Corrective action: add/select an assignable cause. Do the following:
Click Add icon (
) to add a new corrective action. In the Add selectable dialog box, enter the details related to the new corrective action.
Then, click Save.
Click Search icon (
) to select a corrective action already configured. In the Selectable workspace, select the necessary corrective action. The displayed items are all the available corrective action filtered from the selectable list.
Then, click Apply.
Optional: click the Optional switch to do the test without selecting the corrective action.
Allow manual input: click the Allow manual input switch to enable the possibility to add manually a value. This value is saved only for the inspection, it is not added to the corrective action.
Items marked with an asterisk (*) are required.
Dimensional check inspection
Cp/Cpk dimensional check parameters
Name (*): Type the name of the inspection.
Barcode identifier (*): it identifies the inspection. If left blank, the identifier corresponds to the inspection name. When a barcode is scanned on the measuring device, the matching inspections are sent to the device.
Enable barcode regex: click the switch to enable the barcode regex feature. For more information, refer to Barcode regex.
Type: select Dimensional check from the drop down list.
Location: location of the sample to inspect. If necessary, click the Location icon and select a Station or an Assembly part from the location tree.
Method (*): from the Method drop-down list, select Cp/Cpk (dimensional).
Scheduling by time: Add/Select/Delete the scheduling.
Do one of the following:
Click Add icon (
) to add a new scheduling.In the Add scheduling dialog box, enter the details related to the new scheduling.
Then, click Save.
Click Search icon (
) to select a scheduling already configured.In the Scheduling workspace, select the necessary scheduling.
Then, click Apply.
Click Delete icon (
) to delete the selected scheduling.
Parameters
Number of samples: type the number of checks to do.
Input type (*): from the drop down list select between:
Manual input
Automatic only
Physical quantity (*): add/select the sample to inspect.
Do one of the following:
Click Add icon (
) to add a new sample to inspect. In the Add selectable dialog box, enter the details related to the sample to inspect.
Then, click Save.
Click Search icon (
) to select a sample already configured.In the Selectable workspace, select the sample.
Then, click Apply.
Measurement unit (*): from the Measurement unit drop down list, select the measurement unit to use.
Dimension
Nominal (*): type the nominal value. The value can be positive or negative.
Minimum value (*): type the minimum value. The value can be positive or negative.
Maximum value (*): type the maximum value. The value can be positive or negative.
Cp min (*): type the minimum value of Cp.
Cpk min (*): type the minimum value of Cpk.
Advanced parameters
Decimal digits (*): number of digits of the measured dimension value.
Operation guidance
Picture: click the icon to upload an image (max 5 MB) or a video (max 10 MB). This image is sent to STpad/STpalm/STbench.
Instructions: type text instructions to guide the operator in the inspection run.
Verification code: type the verification code that must be entered or scanned when the inspection is run. This field is case-sensitive.
Verification code description: to guide the operator, type the description of the verification code dialog box that is displayed when the inspection is run.
Assignable causes/Corrective action
Assignable cause: add/select an assignable cause. Do the following:
Click Add icon (
) to add a new assignable cause. In the Add selectable dialog box, enter the details related to the new assignable causes.
Then, click Save.
Click Search icon (
) to select an assignable cause already configured. In the Selectable workspace, select the necessary assignable cause. The displayed items are all the available assignable causes filtered from the selectable list.
Then, click Apply.
Optional: click the Optional switch to do the test without selecting the assignable cause.
Allow manual input: click the allow manual input switch to enable the possibility to add manually a value. This value is saved only for the inspection, it is not added to the assignable cause.
Corrective action: add/select an assignable cause. Do the following:
Click Add icon (
) to add a new corrective action. In the Add selectable dialog box, enter the details related to the new corrective action.
Then, click Save.
Click Search icon (
) to select a corrective action already configured. In the Selectable workspace, select the necessary corrective action. The displayed items are all the available corrective action filtered from the selectable list.
Then, click Apply.
Optional: click the Optional switch to do the test without selecting the corrective action.
Allow manual input: click the allow manual input switch to enable the possibility to add manually a value. This value is saved only for the inspection, it is not added to the corrective action.
Items marked with an asterisk (*) are required.
SPC dimensional check parameters
Name (*): type the name of the inspection.
Barcode identifier (*): it identifies the inspection. If left blank, the identifier corresponds to the inspection name. When a barcode is scanned on the measuring device, the matching inspections are sent to the device.
Enable barcode regex: click the switch to enable the barcode regex feature. For more information, refer to Barcode regex.
Type: select Dimension from the drop down list.
Location: location of the sample to inspect. If necessary, click the Location icon and select a Station or an Assembly part from the location tree.
Method (*): from the Method drop-down list, select SPC (dimensional).
Scheduling by time: Add/Select/Delete the scheduling.
Do one of the following:
Click Add icon (
) to add a new scheduling.In the Add scheduling dialog box, enter the details related to the new scheduling.
Then, click Save.
Click Search icon (
) to select a scheduling already configured.In the Scheduling workspace, select the necessary scheduling.
Then, click Apply.
Click Delete icon (
) to delete the selected scheduling.
Parameters
Number of samples: type the number of checks to do.
Subgroup size: type the number of checks to calculate the statistics.
Subgroup frequency: type the frequency of the averages displayed in the X chart and in the SPC rules. For example:
Subgroup frequency = 1 → all subgroups are considered.
Subgroup frequency = 2 → one subgroup every 2 subgroups is considered.
Subgroup frequency = X → one subgroup every X subgroups is considered.
Input type (*): from the drop down list select between:
Manual input
Automatic only
Physical quantity (*): add/select the sample to inspect.
Do one of the following:
Click Add icon (
) to add a new sample to inspect. In the Add selectable dialog box, enter the details related to the sample to inspect.
Then, click Save.
Click Search icon (
) to select a sample already configured.In the Selectable workspace, select the sample.
Then, click Apply.
Measurement unit (*): from the Measurement unit drop down list, select the measurement unit to use.
Dimension
Nominal (*): type the nominal value. The value can be positive or negative.
Minimum value (*): type the minimum value. The value can be positive or negative.
Maximum value (*): type the maximum value. The value can be positive or negative.
Advanced parameters
Decimal digits (*): number of digits of the measured dimension value.
Operation guidance
Picture: click the icon to upload an image (max 5 MB) or a video (max 10 MB). This image is sent to STpad/STpalm/STbench.
Instructions: type text instructions to guide the operator in the inspection run.
Verification code: type the verification code that must be entered or scanned when the inspection is run. This field is case-sensitive.
Verification code description: to guide the operator, type the description of the verification code dialog box that is displayed when the inspection is run.
Assignable causes/Corrective action
Assignable cause: add/select an assignable cause. Do the following:
Click Add icon (
) to add a new assignable cause. In the Add selectable dialog box, enter the details related to the new assignable causes.
Then, click Save.
Click Search icon (
) to select an assignable cause already configured. In the Selectable workspace, select the necessary assignable cause. The displayed items are all the available assignable causes filtered from the selectable list.
Then, click Apply.
Optional: click the Optional switch to do the test without selecting the assignable cause.
Allow manual input: click the allow manual input switch to enable the possibility to add manually a value. This value is saved only for the inspection, it is not added to the assignable cause.
Corrective action: add/select an assignable cause. Do the following:
Click Add icon (
) to add a new corrective action. In the Add selectable dialog box, enter the details related to the new corrective action.
Then, click Save.
Click Search icon (
) to select a corrective action already configured. In the Selectable workspace, select the necessary corrective action. The displayed items are all the available corrective action filtered from the selectable list.
Then, click Apply.
Optional: click the Optional switch to do the test without selecting the corrective action.
Allow manual input: click the allow manual input switch to enable the possibility to add manually a value. This value is saved only for the inspection, it is not added to the corrective action.
Items marked with an asterisk (*) are required.
By part grouping inspection
Name (*): type the name of the inspection.
Barcode identifier (*): it identifies the inspection. If left blank, the identifier corresponds to the inspection name. When a barcode is scanned on the measuring device, the matching inspections are sent to the device.
Enable barcode regex: click the switch to enable the barcode regex feature. For more information, refer to Barcode regex.
Type (*) : select By part from the down drop list.
Part to inspect (*): select the part to inspect. Click the Search icon () and select an Assembly part from the Location card.
Scheduling by time: add/select/delete the scheduling.
Do one of the following:
Click Add icon (
) to add a new scheduling. In the Add Scheduling dialog box, enter the details related to the new scheduling.
Then, click Save.
Click Search icon (
) to select a scheduling already configured. In the Scheduling workspace, select the necessary scheduling.
Then, click Apply.
Click Delete icon (
) to delete the selected scheduling.
Parameters
Number of parts (*): type the number of the parts to inspect.
Start next inspection (*): from the drop-down list, select between:
Always: when a measure is done, the next inspection starts automatically.
OK only: when a measure is done, the next inspection starts automatically only if the previous result is OK.
Never: when a measure is done, manually switch to the next inspection.
Skip disabled: click on the switch to enable/disable the possibility to skip measures of the test.
By default, the skip is disabled. If a measure is skipped, it is not possible to run it later. The skipped measures are not retrieved by QA Supervisor.
Inspections: in the box, all the inspections linked to the selected assembly part are shown.
To change the order of the inspections in the list, select an inspection and then click the Move up icon (
) or the Move down icon ().
Items marked with an asterisk (*) are required.
Cloning an Inspection Definition Details card
On the upper-right corner of the Inspection Definition Details card, click Clone.
The Add Inspection Definition dialog box automatically opens with all the items configured as in the Inspection Definition Details card cloned.
If necessary, in the Add Inspection Definition dialog box, make the necessary changes.
On the upper-right corner of the Add Inspection Definition dialog box, click Save.
Displaying the Inspection Results
On the upper-right corner of the Inspection Definition Details card, click Inspection Results to display the list of all the executions related to the selected inspection.
Setting the inspection filter
On the left-side menu bar, click Inspections > Definitions.
On the upper-right corner of the Definitions workspace, click Filter.
In the Inspections Definition Filter dialog box, set the inspection filter criteria (depending on the customer needs).
On the upper-right corner of the Inspections Definition Filter dialog box, click Apply.
Inspection filter criteria
Inspection name: type the name of the inspection to be filtered.
Barcode identifier: type the barcode identifier to be filtered.
Type: in the box, select type of the inspection to be filtered.
Tool check data: type the name, serial number, or identifier of the Tool.
Joint check data: type the name or identifier of the Joint.
Method: in the box, select the method to be filtered.
Target source: select the target source to be filtered.
Position based: only the Position based inspections are filtered.
Tool based: only the Tool based inspections are filtered.
Multistep: only the Multistep inspections are filtered.
Production based: only the Production based inspections are filtered.
Multistep: in the box, select the multistep to be filtered.
Click Search icon (
).In the Multisteps workspace, select the necessary multistep.
Then, click Apply.
If necessary, delete the multistep selected.
In the box, select it.
Then, click Delete icon (
).Status: select one of the following options, depending on the status of the inspection to be filtered:
Enabled: only the enabled inspections are filtered
Disabled: only the disabled inspections are filtered
Both: all the inspections (Enabled and Disabled) are filtered
Last result: select either OK or NOK, depending on the result of the last execution.
Scheduling: select the scheduling to be filtered.
To select a scheduling, click Search icon (
).In the Scheduling workspace, select the necessary scheduling.
Then, click Apply.
Click Delete icon (
) to delete the selected scheduling.Expiry period: type the expiry period (expressed in percentage) to be filtered.
Verification code: type the verification code of the inspection.
Expiry data range: filter the expiry data range.
Do one of the following:
From - to: click the box: a calendar opens. Select the date from the calendar.
Click Delete icon (
) to delete a date already configured.Range: in the drop-down list, select a specific time interval.
Selected filter: from the drop-down list, select one of the saved customized filter.
For more information on how to manage customized filters, refer to Filters customization.
Working calendar
The Working calendar allows to configure the working days and special events (for example holiday or overtime).
On the left-side menu bar, click Inspections > Working calendar.
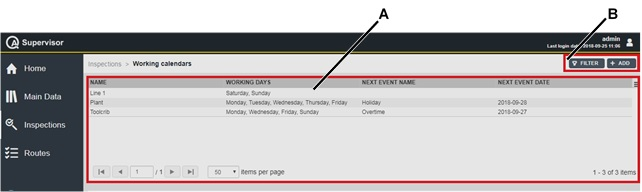
A | Working calendar workspace | B | Command buttons |
The Working calendar workspace is divided into the following columns:
Name: name of the working calendar.
Working days: list of the configured working days of the working calendar.
Next event name: name of the first event configured with a date later than the current date.
Next event date: date of the first event configured with a date later than the current date.
In the Working calendar workspace, click a configured calendar to display the related Working calendar Details card.
In the Event box of theWorking calendar Details card, all the events configured from the selected element of the calendar forward are displayed.
On the upper-right corner of the Working calendar Details card, click the Close button to exit the card.
At the end of the Working calendar Details card, the following items record all of the changes made for the selected scheduling:
Version: version of the working calendar configuration.
In the Edit Working calendar dialog box, change the Working days or the Events to make a new version.
Changed by: name of the operator who has made a change to the working calendar configuration.
History: the history table records all the changes made for the selected working calendar.
The first line of the history table summarizes the latest version of the working calendar configuration. Click a previous line: the related Working calendar Details card opens on the left of the Working calendar Details card related to the latest version. The differences between the two Working calendar Details cards are yellow highlighted.
On the upper-right corner of the Working calendar workspace, there are the following command buttons:
Add: click to add a new working calendar into the Working calendar workspace.
Filter: click to give filters and list only the necessary working calendar(s).
Adding a working calendar
On the left-side menu bar, click Inspections > Working calendars.
On the upper-right corner of the Working calendars workspace, click Add.
In the Add working calendar dialog box, configure the working calendar parameters.
On the upper-right corner of the Add working calendar dialog box, click Save.
Editing a Working calendar details card
On the upper-right corner of the Working calendar Details card, click Edit.
In the Edit Working calendar dialog box, make the necessary changes.
On the upper-right corner of the Edit Working calendar dialog box, click Save.
Working calendar parameters
Name (*): type the name of the working calendar.
Description: type a description of the working calendar.
Working days: select one or more days of the week to configure as working days.
Events
Calendar: select the month to be displayed.
Do one of the following:
Click Today to highlight the current date in the calendar.
The current day is highlighted in yellow.
Click Years to displayed the annual calendar.
It is possible to change the year by clicking the left/right arrow icons (
 )
)Click Month to displayed the calendar of the month.
It is possible to change the month by clicking the left/right arrow icons (
)
Events: add/delete an event.
Do one of the following:
Click Add icon (
) to add a new event. In the Add event dialog box, enter the details related to the new event: name, event type (by selecting working day or Non-working day) and the event date (by selecting the date from a calendar).
Then, click Save.
Click Delete icon (
) to delete the selected event.
Items marked with an asterisk (*) are required.
Cloning a Working calendar details card
On the upper-right corner of the Working calendar Details card, click Clone.
The Add Working calendar dialog box automatically opens with all the items configured as in the Working calendar Details card cloned.
If necessary, in the Add Working calendar dialog box, make the necessary changes.
On the upper-right corner of the Add Working calendar dialog box, click Save.
Setting the Working calendar filter
On the left-side menu bar, click Inspections > Working calendar.
On the upper-right corner of the Working calendar workspace, click Filter.
In the Working calendar Filter dialog box, set the working calendar filter criteria (depending on the customer needs).
On the upper-right corner of the Working calendar Filter dialog box, click Apply.
Working calendar filter criteria
Name: type the name of the working calndar to be filtered.
Status: in the drop-down list, select one of the following options, depending on the status of the working calendar to be filtered: Enabled, Disabled, and Both.
Selected filter: from the drop-down list, select one of the saved customized filter.
For more information on how to manage customized filters, refer to Filters customization.
Scheduling
On the left-side menu bar, click Inspections > Scheduling.
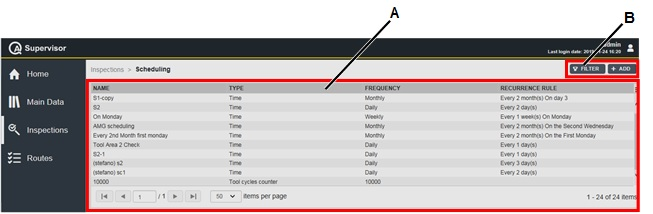
A | Scheduling workspace | B | Command buttons |
The Scheduling workspace is divided into the following columns:
Name: name of the scheduling.
Type: type of scheduling. The options are:
Time: the scheduling is defined according to a period of time
Tool usage counter: the scheduling is defined according to the number of tightenings performed by a tool.
Frequency: frequency of the scheduling.
Recurrence rule: recurrence of the configured scheduling.
In the Scheduling workspace, click a scheduling to display the related Scheduling Details card.
On the upper-right corner of the Scheduling Details card, click the Close button to exit the Scheduling Details card.
At the end of the Scheduling Details card, the following items record all of the changes made for the selected scheduling:
Version: version of the scheduling configuration.
In the Edit Scheduling dialog box, change the Frequency to make a new version.
Changed by: name of the operator who has made a change to the scheduling configuration.
History: the history table records all of the changes made for the selected scheduling.
The first line of the history table summarizes the latest version of the scheduling configuration. Click a previous line: the related Scheduling Details card opens on the left of the Scheduling Details card related to the latest version. The differences between the two Scheduling Details cards are yellow highlighted.
On the upper-right corner of the oldest Scheduling Details card, click Restore: the previous version of the scheduling configuration becomes the latest one.
On the upper-right corner of the Scheduling workspace, there are the following command buttons:
Add: click to add a new scheduling into the Scheduling workspace.
Filter: click to give filters and list only the necessary scheduling(s).
Adding a Scheduling
On the left-side menu bar, click Inspections > Scheduling.
On the upper-right corner of the Scheduling workspace, click Add.
In the Add Scheduling dialog box, configure the scheduling parameters.
On the upper-right corner of the Add Scheduling dialog box, click Save.
Editing a Scheduling
On the upper-right corner of the Scheduling Details card, click Edit.
In the Edit Scheduling dialog box, make the necessary changes.
On the upper-right corner of the Edit Scheduling dialog box, click Save.
Scheduling by time parameters
Name (*): type the name of the scheduling.
Type (*): select Time.
Frequency (*): in the drop-down list, select the frequency of the scheduling.
After selecting the frequency, the following items are displayed depending on the frequency selected:
Hourly: type the number of hours between two executions.
Daily: type the number of days between two executions.
Weekly: select the days of the week for the execution of the inspection.
Monthly: in the Every box, type the number of the months between two executions.
Then, do one of the following:
In the On day box, type the day of the execution (this option is selected by default).
In the first On the drop-down lists, select one of the following frequency options in the first drop-down list: First, Second, Third, Fourth, and Last.
Then, in the second On the drop-down list, select one of the following “day option”: Monday, Tuesday, Wednesday, Thursday, Friday, Saturday, Sunday, Day, Weekday, and Weekend day.
Yearly: do one of the following:
In the On drop-down list, select the month of the execution
Then, in the box on the right of the On drop-down list, type the day (this option is selected by default).
In the first On the drop-down lists, select one of the following frequency options in the first drop-down list: First, Second, Third, Fourth, and Last.
In the second On the drop-down lists, select one of the following “day option”: Monday, Tuesday, Wednesday, Thursday, Friday, Saturday, Sunday, Day, Weekday, and Weekend day.
Then, in the third On the drop-down list, select the month of the execution.
Calendar: add/select/delete a working calendar.
This field is enabled only for scheduling with frequency equal to Daily.
Do one of the following:
Click Add icon (
) to add a new working calendar. In the Add working calendar dialog box, enter the details related to the new working calendar.
Then, click Save.
Click Search icon (
) to select a working calendar already configured. In the Working calendar workspace, select the necessary scheduling.
Then, click Apply.
Click Delete icon (
) to delete the link with the selected working calendar.
Items marked with an asterisk (*) are required.
Scheduling by tool usage parameters
Use this scheduling only if the connection with ToolsNet 8 is enabled.
This type of scheduling is available only for the Tool check inspections of Tool used in production. The inspection expires when the number of tightenings performed in production exceed the number of cycles defined in the scheduling configuration.
This scheduling can be associated to only one inspection for each tool.
Name (*): type the name of the scheduling.
Type (*): select Tool usage counter.
Number of cycles (*): type the number of tightenings to do before the inspection expires
Cloning a Scheduling Details card
On the upper-right corner of the Scheduling Details card, click Clone.
The Add Scheduling dialog box automatically opens with all the items configured as in the Scheduling Details card cloned.
If necessary, in the Add Scheduling dialog box, make the necessary changes.
On the upper-right corner of the Add Scheduling dialog box, click Save.
Setting the scheduling filter
On the left-side menu bar, click Inspections > Scheduling.
On the upper-right corner of the Scheduling workspace, click Filter.
In the Scheduling Filter dialog box, set the scheduling filter criteria (depending on the customer needs).
On the upper-right corner of the Scheduling Filter dialog box, click Apply.
Scheduling filter criteria
Name: type the name of the scheduling to be filtered.
Type: in the drop-down list, select one of the following option, depending on the type of the scheduling to be filtered: Time, Tool usage counter.
Frequency: in the drop-down list, select one of the following options, depending on the frequency of the scheduling to be filtered: Hourly, Daily, Weekly, Monthly, and Yearly.
Status: in the drop-down list, select one of the following options, depending on the status of the scheduling to be filtered: Enabled, Disabled, and Both.
Selected filter: from the drop-down list, select one of the saved customized filter.
For more information on how to manage customized filters, refer to Filters customization.
Multisteps
On the left-side menu bar, click Inspections > Multisteps.
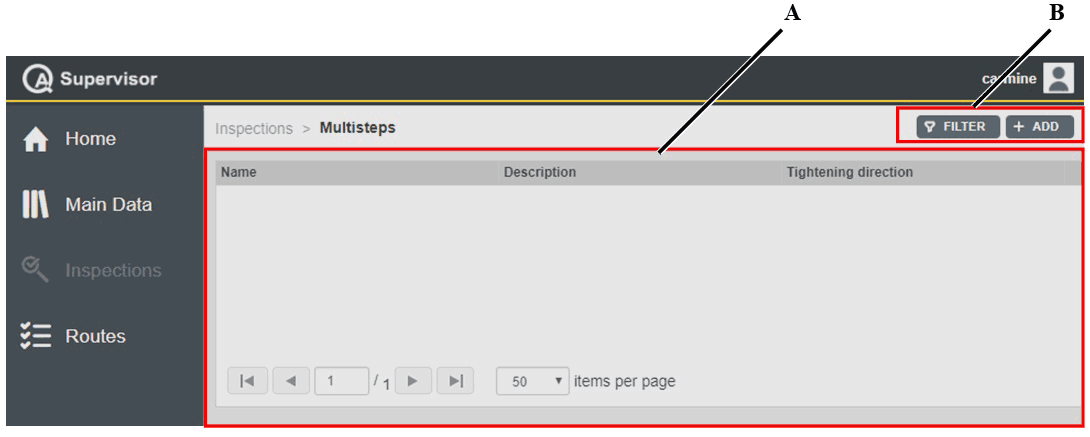
A | Multisteps workspace | B | Command buttons |
The Multisteps workspace is divided into the following columns:
Name: name of the multistep.
Description: description of the multistep.
Tightening direction: direction of the multistep tightenings.
In the Multisteps workspace, click a multistep to display the related Multisteps Details card.
On the upper-right corner of the Multisteps Details card, click the Close button to exit the Multisteps Details card.
On the right of the Multisteps Details card, the following items record all of the changes made for the selected scheduling:
Version: version of the scheduling configuration.
In the Edit Multistep Program dialog box, change the following items to make a new version: Name, Description, Tightening direction, Status, and Editor box.
Changed by: name of the operator who has made a change to the multistep configuration.
History: The history table records all of the changes made for the selected multistep.
The first line of the history table summarizes the latest version of the multistep configuration. Click a previous line: the related Multistep Details card opens.
On the upper-right corner of the oldest Multistep Details card, click Restore: the previous version of the multistep configuration becomes the latest one.
On the upper-right corner of the Multisteps workspace, there are the following command buttons:
Add: click to add a new multistep into the Multisteps workspace.
Filter: click to give filters and list only the necessary multistep(s).
Adding a multistep
On the left-side menu bar, click Inspections > Multisteps.
On the upper-right corner of the Multisteps workspace, click Add.
In the Add Multistep Program dialog box, configure the multistep parameters.
On the upper-right corner of the Add Multistep Program dialog box, click Save.
Editing a Multistep Details card
On the upper-right corner of the Multistep Details card, click Edit.
In the Edit Multistep Program dialog box, make the necessary changes.
On the upper-right corner of the Edit Multistep Program dialog box, click Save.
Multistep parameters
Name (*): type the name of the multistep.
Description (*): type the description of the multistep.
Tightening direction (*): select one of the following options:
CW: clockwise direction.
CCW: counterclockwise direction.
Editor box: in the box, configure the steps sequence as follows:
On the right of the Editor box, from the Toolbox, drag an item to the Editor workspace.
The available items are as follows:
Torque: measured torque in the tightening direction selected by tightening direction option button.
Angle: measured torque in the tightening direction selected by tightening direction option button.
Torque loosening: measured torque in the opposite direction of the tightening direction selected by tightening direction option button.
Angle loosening: measured torque in the opposite direction of the tightening direction selected by tightening direction option button.
In case of multistep, select Torque as the first step.
In the Editor workspace, click the item.
On the bottom of the Editor workspace, a Data dialog box that configures the item selected is displayed.
Configure the Data dialog box.
On the bottom of the Data dialog box, click Delete to delete the step configuration.
Items marked with an asterisk (*) are required.
Cloning a Multistep Details card
On the upper-right corner of the Multistep Details card, click Clone.
The Add Multistep Program dialog box automatically opens with all the items configured as in the Multistep Details card cloned.
If necessary, in the Add Multistep Program dialog box, make the necessary changes.
On the upper-right corner of the Add Multistep Program dialog box, click Save.
Setting the multistep filter
On the left-side menu bar, click Inspections > Multisteps.
On the upper-right corner of the Multisteps workspace, click Filter.
In the Multistep Filter dialog box, set the multistep filter criteria (depending on the customer needs).
On the upper-right corner of the Multistep Filter dialog box, click Apply.
Multistep filter criteria
Name: type the name of the multistep to be filtered.
Tightening direction: in the drop-down list, select one of the following options, depending on the tightening direction of the multistep to be filtered: CW and CCW.
Status: in the drop-down list, select one of the following options, depending on the status of the multistep to be filtered: Enabled, Disabled, and Both.
Selected filter: from the drop-down list, select one of the saved customized filter.
For more information on how to manage customized filters, refer to Filters customization.
Traces
On the left-side menu bar, click Inspections > Traces.
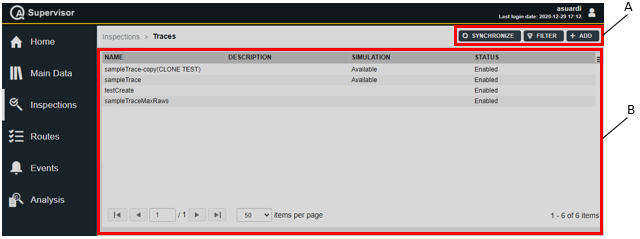
A | Command buttons | B | Traces workspace |
The Traces workspace is divided into the following columns:
Name: name of the trace.
Description: description of the trace.
Simulation: below are the available options:
Available: the simulated trace is present.
Blank: the simulated trace is not present.
Status: below are the available options:
Enabled: the entity is enabled.
Disabled: the entity is disabled.
In the Traces workspace, click a trace to display the related Trace Details card.
On the upper-right corner of the Trace Details card, click the Close button to exit the Trace Details card (without saving any change).
At the end of the Trace Details card, the following items record all of the changes made for the selected trace:
History: the history table records all of the changes made for the selected trace.
The first line of the history table summarizes the latest version of the trace configuration.
Click a previous line: the related Trace Details card opens on the left of the Trace Details card related to the latest version. The differences between the two Trace Details cards are yellow highlighted.
On the upper-right corner of the oldest Trace Details card, click Restore: the previous version of the trace configuration becomes the latest one.Version: version of the trace configuration.
Revision: change made on a device to the trace configuration version.
Changed by: name of the operator who has made a change to the trace configuration.
Changed on: optional field, it appears only if the change to the trace configuration was made by an operator on a device.
Adding a Trace
On the left-side menu bar, click Inspections > Traces.
On the upper-right corner of the Traces workspace, click Add.
In the Add trace card, configure the trace parameters.
On the upper-right corner of the Add trace card, click Save.
Editing a Trace
On the upper-right corner of the Trace details card, click Edit.
In the Edit trace card, make the necessary changes.
On the upper-right corner of the Edit trace card, click Save.
Trace parameters
Name (*): type the name of the trace.
Description: type the description of the trace.
Measurement unit (*): select the measuring unit for the trace.
The default measurement unit is defined both in the Application settings and in the Personal settings.
Chart type: select the type of chart to display.
This field is available after adding at least one raw trace.Add/delete a raw trace.
Do one of the following:Click Add icon (
) and select one of the following options:Import from ToolsNet 8: in the Toolsnet 8 Traces Filter card, select the tool, the tightening program and finally the results to import as curves.
Import from file: select the files to import from the PC. The supported formats are .qap and .txt. Multiple selection is supported.
For information on the file, refer to Requirements for raw traces files
Traces can be imported from both files and ToolsNet 8, for a total maximum of 10 traces.
Click Delete icon (
) to delete the selected trace.
Synchronizing Traces
On the upper-right corner of the Traces workspace, click on Synchronize.
In the Trace Synchronization card, select the measuring device to synchronize from the drop-down list.
If there is no measuring device enabled to process traces, the message No suitable device found for trace synchronization is displayed.
Click on Apply.
By clicking on Synchronize, all the traces configured in QA Supervisor are synchronized with those of the target device, and vice versa.
If during the synchronization multiple changes on the same trace are found on the measuring device, those intermediate modifications will be marked in the changes history as revisions.
If the last change is more recent than the last version in QA Supervisor, it is marked as a new version; otherwise, also the last change is marked as a revision.
To create a new version from a revision, click on the revision and then on the Restore button.
The changes history is available in the Trace details card of the trace.
Cloning a Trace Details card
On the upper-right corner of the Trace Details card, click Clone.
The Add Trace card automatically opens with all the items configured as in the Trace Details card cloned.
If necessary, in the Add Trace card, make the necessary changes.
On the upper-right corner of the Add Trace card, click Save.
Setting the Trace filter
On the left-side menu bar, click Inspections > Traces.
On the upper-right corner of the Traces workspace, click Filter.
In the Traces Filter dialog box, set the traces filter criteria.
On the upper-right corner of the Traces Filter dialog box, click Apply.
Trace filter criteria
Name: type the name of the trace to be filtered.
Simulation: from the drop-down list, select between:
Not present: filter traces that are not processed.
Present: filter traces that are processed.
Both: filter both processed and unprocessed traces.
Status: from the drop-down list, select the status of the traces to filter.
Selected filter: from the drop-down list, select one of the saved customized filter.
For more information on how to manage customized filters, refer to Filters customization.
Routes page
The Route is a set of tests to run.
There are two different types of routes:
Manual route: it is a set of inspections selected from the inspection list.
Parametric route: it is a set of inspections filtered from the inspection list by location, type, method and expiry date/period. This type of route allows to collect all the inspections with the same parameters.
On the left-side menu bar, click Routes.
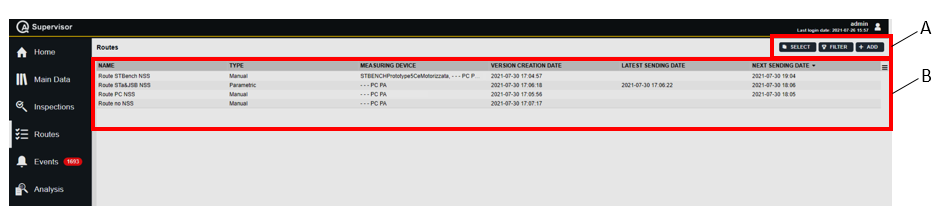
A | Command buttons | B | Routes workspace |
The Routes workspace is divided in the following columns:
Name: name of the route.
Type: type of the route.
Measuring device: name of the measuring device that receives the route.
Version creation date: creation date of the route version.
Latest sending date: date of the last successful sending.
Next sending date: date of the next scheduled sending.
In the Routes workspace, click a measuring device to display the related Route Details card.
On the upper-right corner of the Route Details card, click the Close button to exit the Route Details card.
At the bottom of the Route Details card, the following items record all of the changes made for the selected route:
Version: version of the route configuration.
In the Edit Route dialog box, change one of the following items to make a new version: Name and Inspection.
Changed by: name of the operator who has made a change to the route configuration.
History: the history table records all of the changes made for the selected route.
The first line of the history table summarizes the latest version of the route configuration. Click a previous line: the related Route Details card opens on the left of the Route Details card related to the latest version.
The differences between the two Route Details cards are yellow highlighted.
On the upper-right corner of the oldest Route Details card, do one of the followings:
click Restore: the previous version of the route configuration becomes the latest one.
click Sent route: a new card with the list of the sent route with the selected version is shown.
On the upper-right corner of the Routes workspace, there are the following command buttons:
Select: click on the button to select the routes to synchronize.
Cancel: enabled when the Select button is clicked. It disables the multiple synchronization.
Send: enabled when the Select button is clicked. It starts the synchronization of the selected routes.
Add: click to add a new route into the Routes page.
Filter: click to give filters and list only the necessary route(s).
Adding a Route
On the left-side menu bar, click Routes.
On the upper-right corner of the Routes workspace, click Add.
In the Add Route dialog box, configure the route parameters.
On the upper-right corner of the Add route dialog box, click Save.
Manual route parameters
Items marked with an asterisk (*) are required.
Name (*): type the name of the route.
Barcode identifier: it identifies the route. If left blank, the identifier corresponds to the route name. When a barcode is scanned on the measuring device, the matching routes are sent to the device.
Enable barcode regex: click the switch to enable the barcode regex feature. For more information, refer to Barcode regex.
Description: type a description of the route.
Scheduling by time: add/select/delete the scheduling.
Do one of the following:Click Add icon (
) to add a new scheduling.
In the Add Scheduling dialog box, enter the details related to the new scheduling. The Type is set to Time.
Then, click Save.Click Search icon (
) to select a scheduling already configured.
In the Scheduling workspace, select the necessary scheduling. Only the Scheduling by time are shown.
Then, click Apply.Click Delete icon (
) to delete the selected scheduling.
Parameters
Measuring devices (*): in the box, select the measuring devices that receive the route.
It is possible to select more than one measuring devices. The route is sent to all the selected measuring device(s) and only the supported inspection are available on the measuring device(s).
Do one of the following:Click Add icon (
) to add a new measuring device.
In the Add Measuring Device dialog box, enter the details related to the new measuring device.
Then, click Save.Click Search icon (
) to select a measuring device already configured.
In the Measuring Devices workspace, select the required measuring device.
Then, click Apply.
Inspection sequence (*): select the order in which the inspection is run. The available options are:
Free: the inspections can be run in any order.
Forced by inspection: the inspections can be run only in the order established in the route definition.
Free is the default value.
Start next inspection (*): from the drop-down list, select between:
Always: when an inspection is done, the next inspection starts automatically.
Never: when an inspection is done, manually switch to the next inspection.
Always is the default value. This parameter is available only if the Inspection sequence is set to Forced by inspection.
Skip disabled: click on the switch to enable/disable the possibility to skip an inspection. If an inspection is skipped, it is not possible to do it later.
By default, the skip is disabled. This parameter is available only if the Inspection sequence is set to Forced by inspection.Execution mode (*): select Single mode to perform only one time the inspection(s) linked to the route during the test or Multiple mode to perform the inspection(s) linked to the route more than one time during the test.
Multiple mode is the default value.Type (*): select Manual from the drop down list
Inspections: in the box, select the necessary inspection.
To add a new inspection, click Add icon (
).
In the Add inspection dialog box, enter the details related to the new inspection.
Then, click Save.To select an inspection already configured, click Search icon (
).
In the Inspection definitions workspace, select the necessary inspection.
Then, click Apply.To delete an inspection already configured, in the Inspections box, select it.
Then, click Delete icon ().To change the order of the inspections in the list, select an inspection and then click the Move up icon (
) or the Move down icon ().
Traceability tag
To add a new traceability tag, click Add icon (
).
In the Add traceability tag dialog box, enter the following details related to the new traceability tag:Name (*): type the name of the traceability tag.
Level (*): select level at which use the traceability tag. The available levels are: route, inspection, part, and sample.
Optional: click the Optional switch to do the test without using the traceability tag.
Source (*): select the source of the traceability tag. The available sources are: keyboard, barcode, and picklist.
List (*): select the traceability tag definition. This parameter is available only if Source is set to Picklist.
To add a new definition, click Add icon (
).
In the Add selectable dialog box, enter the details related to new inspection. Then, click Save.
In the Add selectable dialog box, only traceability tag type is available.
To select a traceability tag already configured, click Search icon ().
In the Selectable workspace, select the necessary inspection. Then, click Apply.
In the Selectable card, only the selectable with traceability tag type are shown.
To delete a selected traceability tag, in the List box, select it. Then, click Delete icon ().Allow manual input: click the allow manual input switch to enable the possibility to add manually a value. This value is saved only for the route, it is not added to the traceability tag definition.
Collection point (*): select when use the traceability tag. The available collective point are: before, and after.
To edit a traceability tag configured, in the Traceability tag box, select it. Then click the Edit icon (
).
In the Edit traceability tag dialog box, edit the traceability tag details. Then, click Save.To delete a traceability tag already configured, in the Traceability tag box, select it. Then, click Delete icon (
)To change the order of the traceability tag in the list, select a traceability tag and then click the Move up icon (
) or the Move down icon ().Traceability tag on resume: click the traceability tag on resume switch to enable/disable the traceability tag request when a test is resumed.
By default, the switch is set to disabled.
Custom fields
Custom field 1-5: by default, these fields are populated with the custom fields configured in the Application custom fields.
To add/select/remove the custom fields linked to the route, do one of the following:Click Add icon (
) to add a new custom field.
In the Add Selectable card, configure the available parameters related to the new custom field.
Then, click Save.Click Search icon (
) to select a custom field already configured.
In the Selectables card, select a custom field from the list.
Then, click Apply.Click Delete icon (
) to remove the custom field.
If a new custom field is created, it must be added in the Application custom fields in order to be sent to the device.
Value: from the drop-down list of each custom field enabled, select a value.
Parametric route parameters
Items marked with an asterisk (*) are required.
Name (*): type the name of the route.
Barcode identifier: it identifies the route. If left blank, the identifier corresponds to the route name. When a barcode is scanned on the measuring device, the matching routes are sent to the device.
Enable barcode regex: click the switch to enable the barcode regex feature. For more information, refer to Barcode regex.
Description: type a description of the route.
Scheduling by time: add/select/delete the scheduling.
Do one of the following:Click Add icon (
) to add a new scheduling.
In the Add Scheduling dialog box, enter the details related to the new scheduling. The Type is set to Time.
Then, click Save.Click Search icon (
) to select a scheduling already configured.
In the Scheduling workspace, select the necessary scheduling. Only the Scheduling by time are shown.
Then, click Apply.Click Delete icon (
) to delete the selected scheduling.
Parameters
Measuring devices (*): in the box, select the measuring devices that receive the route.
It is possible to select more than one measuring devices. The route is sent to all the selected measuring device(s) and only the supported inspection are available on the measuring device(s).
Do one of the following:Click Add icon (
) to add a new measuring device.
In the Add Measuring Device dialog box, enter the details related to the new measuring device.
Then, click Save.Click Search icon (
) to select a measuring device already configured.
In the Measuring Devices workspace, select the required measuring device.
Then, click Apply.
Inspection sequence (*): select the order in which the inspection is run. The available options are:
Free: the inspections can be run in any order.
Forced by inspection: the inspections can be run only in the order established in the route definition.
Free is the default value.
Start next inspection (*): from the drop-down list, select between:
Always: when an inspection is done, the next inspection starts automatically.
Never: when an inspection is done, manually switch to the next inspection.
Always is the default value. This parameter is available only if the Inspection sequence is set to Forced by inspection.
Skip disabled: click on the switch to enable/disable the possibility to skip an inspection. If an inspection is skipped, it is not possible to run it later.
By default, the skip is disabled. This parameter is available only if the Inspection sequence is set to Forced by inspection.Execution mode (*): select Single mode to perform only one time the inspection(s) linked to the route during the test or Multiple mode to perform the inspection(s) linked to the route more than one time during the test.
Multiple mode is the default value.Type (*): select Parametric from the drop down list.
Inspections to include
Location (*): select the area of the plant where using the new joint.
Do as follows:Click Location icon (
).
In the Location dialog box, select the area of the plant. Then, click Apply.Type: in the box, select the inspection type.
Method: in the box, select the inspection method.
Expiry date: in the box, select the expiry date.
Expiry period: type the expiry period (expressed in percentage) to be filtered.
Failed in the last: type the number of days to be filtered. The value ranges from 1 to 30 days.
Last status: in the box, select the status of the inspections to be included between:
Partial: only the inspections whose last status is Partial are filtered.
Completed: only the inspections whose last status is Completed are filtered.
Abandoned: only the inspections whose last status is Abandoned are filtered.
Traceability tag
To add a new traceability tag, click Add icon (
).
In the Add traceability tag dialog box, enter the following details related to the new traceability tag:Name (*): type the name of the traceability tag.
Level (*): select level at which use the traceability tag. The available levels are: route, inspection, part, and sample.
Optional: click the Optional switch to do the test without using the traceability tag.
Source (*): select the source of the traceability tag. The available sources are: keyboard, barcode, and picklist.
List (*): select the traceability tag definition. This parameter is available only if Source is set to Picklist.
To add a new definition, click Add icon (
).
In the Add selectable dialog box, enter the details related to new inspection. Then, click Save.
In the Add selectable dialog box, only traceability tag type is available.
To select a traceability tag already configured, click Search icon ().
In the Selectable workspace, select the necessary inspection. Then, click Apply.
In the Selectable card, only the selectable with traceability tag type are shown.
To delete a selected traceability tag, in the List box, select it. Then, click Delete icon ().Allow manual input: click the allow manual input switch to enable the possibility to add manually a value. This value is saved only for the route, it is not added to the traceability tag definition.
Collection point (*): select when use the traceability tag. The available collective point are: before, and after.
To edit a traceability tag configured, in the Traceability tag box, select it. Then click the Edit icon (
).
In the Edit traceability tag dialog box, edit the traceability tag details. Then, click Save.To delete a traceability tag already configured, in the Traceability tag box, select it. Then, click Delete icon (
)To change the order of the traceability tag in the list, select a traceability tag and then click the Move up icon (
) or the Move down icon ().Traceability tag on resume: click the traceability tag on resume switch to enable/disable the traceability tag request when a test is resumed.
By default, the switch is set to disabled.
Custom fields
Custom field 1-5: by default, these fields are populated with the custom fields configured in the Application custom fields.
To add/select/remove the custom fields linked to the route, do one of the following:Click Add icon (
) to add a new custom field.
In the Add Selectable card, configure the available parameters related to the new custom field.
Then, click Save.Click Search icon (
) to select a custom field already configured.
In the Selectables card, select a custom field from the list.
Then, click Apply.Click Delete icon (
) to remove the custom field.
If a new custom field is created, it must be added in the Application custom fields in order to be sent to the device.
Value: from the drop-down list of each custom field enabled, select a value.
Editing a Route Details card
On the upper-right corner of the Route Details card, click Edit.
In the Edit Route dialog box, make the necessary changes.
On the upper-right corner of the Edit Route dialog box, click Save.
Cloning a Route Details card
On the upper-right corner of the Route Details card, click Clone.
The Add Route dialog box automatically opens with all the items configured as in the Route Details card cloned.
If necessary, in the Add Route dialog box, make the necessary changes.
On the upper-right corner of the Add Route dialog box, click Save.
Sending a Route to the measuring devices
To send a route manually to the measuring devices: on the upper-right corner of the Route Details card, click Send.
If the route is correctly sent to the measuring device, a green notification message is displayed.
If the route is not sent to the measuring device, an error message alerts the user about the problem that occurred.
If one or more inspections are not supported by the measuring devices or have some parameters out of the measuring device range, the route is sent without them. In the Inspection table of the Route card, the inspections not sent are highlighted with a colored bar:
grey: the inspection is disabled or not licensed.
yellow: the inspection is not sent to one or to some of configured the measuring devices.
red: the inspections are not sent to all the configured measuring devices.
To view the list of the inspection not sent, click the View unsupported inspection details link under the inspection table. The Unsupported inspections card opens and lists all the inspections not sent to the measuring devices. For each inspection, the explanation of the error occurred is displayed.
It is possible to group the unsupported inspections by measuring device or by inspection, by clicking the By measuring device/By inspection button on the upper-right corner of the Unsupported inspections card.
To receive the route on STbench/STpad/STpalm, the measuring devices must be in the main pages of the application (Home, Route, Results, Tools, Joints, Measuring devices, Parts, Controllers). Otherwise, an Information message is displayed on the devices.
From software version 06.01x, a pop-up is displayed during the synchronization with STbench/STpad/STpalm.
Sending a route by scheduling
When a time scheduling is associated to a route, the route is automatically sent to the measuring device(s) as scheduled, provided that the target measuring device(s) is online.
The first automatic sending of a planned route is always made at the route creation.
The status of a planned route can be checked by clicking the Sent routes button from the Route details card.
The possible statuses of a route are:
Sent: the route has been sent to the measuring device.
Pending: the measuring device is offline at the time of the scheduled sending and the route will be sent as soon as the measuring device gets online.
Not sent: the sending has failed because the measuring device was offline at the sending time scheduled.
Got result: the results of the route have been retrieved from the measuring device.
The routes displayed in the Sent routes card always refer to the current version of the route, or to the specific route version selected.
If a scheduling is linked to a working calendar, the Next sending date of the route is calculated considering the working and non-working days set in the calendar.
Displaying the Routes sent to the measuring device
On the upper-right corner of the Route Details card, click Sent Routes.
The Sent Routes card is displayed.Select one of the item in the Sent route list to open the Sent route inspection card.
In the Sent inspections card, the results related to each inspection in the route are shown.
Setting the routes filter
On the left-side menu bar, click Routes.
On the upper-right corner of the Routes workspace, click Filter.
In the Routes Filter dialog box, set the route filter criteria (depending on the customer needs).
On the upper-right corner of the Routes Filter dialog box, click Apply.
Route filter criteria
Name: type the name of the route to be filtered (partial matching is supported).
Barcode identifier: type the barcode identifier defined for the route to be filtered.
Measuring devices: in the box, select the necessary measuring device.
To select a measuring device, click Search icon (
).In the Measuring Devices workspace, select the necessary measuring device.
Then, click Apply.
To delete a measuring device, in the Measuring devices box, select it.
Then, click Delete icon (
).Inspections: in the box, select the necessary inspection.
To select an inspection, click Search icon (
).In the Inspections Definitions workspace, select the necessary inspection.
Then, click Apply.
To delete an inspection, in the Inspections box, select it.
Then, click Delete icon (
).
Status: in the drop-down list, select the status (of the route) to be filtered.
Type: in the drop-down list, select the type (of the route) to be filtered
Range data creation: filter the creation data range.
Do one of the following:
From - to: click the box: a calendar opens. Select the date from the calendar.
Click Delete icon (
) to delete a date already configured.Range: in the Range drop-down list, select a specific time interval.
Selected filter: from the drop-down list, select one of the saved customized filter.
For more information on how to manage customized filters, refer to Filters customization.
Events
On the left-side menu bar, click Events.
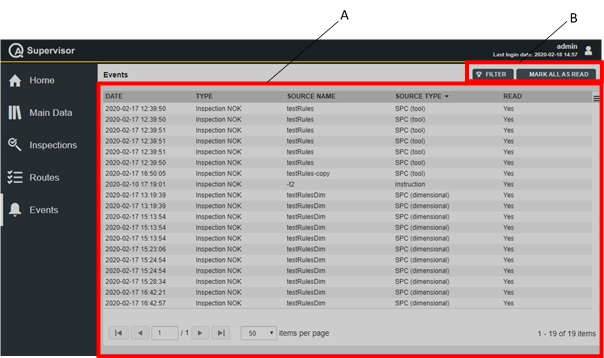
A | Events workspace | B | Command buttons |
The Events workspace shows the Notifications received online and is divided in the following columns:
Date: date and time the notification is sent.
Type: type of notification.
Inspection NOK
Inspection expired
Inspection expiring
Certificate expired
Program changed
Tool import
Tool model import
Source name: name of the inspection or name of the certificate.
Source type: type of inspection.
For the certificates, this column is left blank.
Read: Yes or No.
On the upper-right corner of the Events workspace, there are the following command buttons:
Filter: click on the button to filter the list of events displayed in the Events workspace.
Mark all as read: click on the button to mark all the Events of the list as Read - Yes.
In the Events workspace, click on the events to open the respective Details cards.
Inspection NOK
By clicking on an Inspection NOK event, the related Inspection Result Details card will open (for more information, see Inspection result details card).
Inspection expired
By clicking on an Inspection expired event, the related Inspection Definition Details card will open (for more information, see Definitions).
Inspection expiring
By clicking on an Inspection expiring event, the related Inspection Definition Details card will open (for more information, see Definitions).
Certificate expired
By clicking on a Certificate expired event, the related Measuring Device Details card or Transducer Details card will open depending on the target object (for more information, see Measuring devices or Transducers).
Program changed
By clicking on a Program changed event, the related Tightening Program card will open. Below are the items displayed on the card:
Name: name of the program.
Torque: torque target.
Torque min: lower torque limit.
Torque max: higher torque limit.
Angle: angle target.
Min angle: lower angle limit.
Max angle: higher angle limit.
Affected Inspections table: list with name and version of the inspections affected by the program change.
Unaffected inspections table: list with name and version of the inspections not affected by the program change.
Click on the inspection name to open the related Inspection Definition Details card.
In case of unaffected inspections, a report is displayed at the bottom of the of the Tightening Program card, stating why the selected inspection has not been affected by the program change.
Tool import
By clicking on a Tool import event, the related Tool Details card will open (for more information, see Tools).
Tool model import
By clicking on a Tool model import event, the related Tool Model Details card will open (for more information, see Tool models).
Tool Swap
By clicking on a Tool Swap event, the related Tool Swap Operation Details card will open (for more information, see Tool Swap)
By clicking on an item of the Events list, the event is marked as read.
The Notification system displays alerts of the events when they happen, they don’t reflect the status of the events at the moment when they are read.
For instance, if an inspection expires the notification is sent; if the inspection is then executed, the notification is still displayed.
In order to have a live overview of the inspection status, other solutions are available such as the Dashboard or the Inspection Definition card.
Analysis
On the left side of the menu bar, click Analysis to configure the reports parameters.
Capability report
On the left side of the menu bar, click Analysis > Capability report.
With the Capability report it is possible for the user to:
Use control charts to monitor the stability of the process by identifying out-of-control points, patterns and trends in the data, thus determining whether the process is stable and in control.
|
|
|
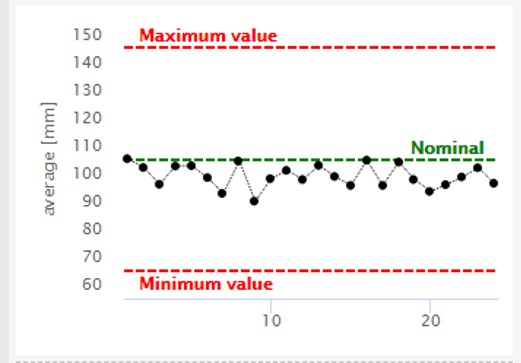
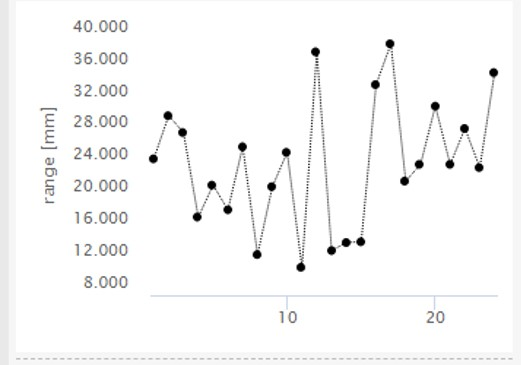
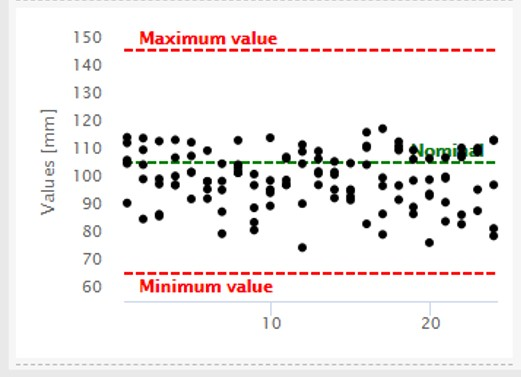
Use the probability plot to assess the requirement that the data follow a normal distribution and the Gaussian chart to analyze the process spread and to evaluate the center of the process, thus determining whether the data follow a normal distribution.
|
|
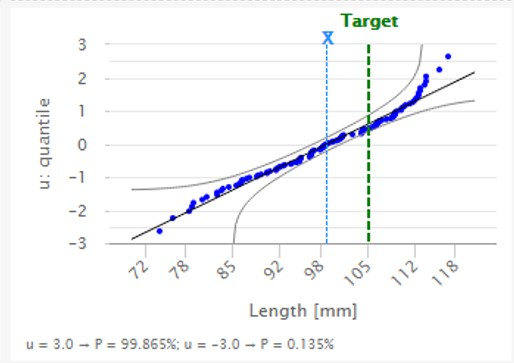
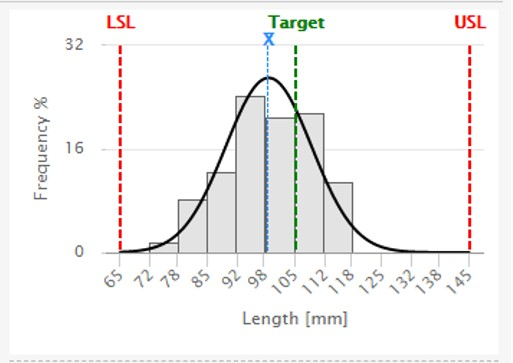
Use the capability indices to evaluate to what extent the process meets the requirements, thus estimating the overall capability (Pp, Ppk) and potential capability (Cp, Cpk).
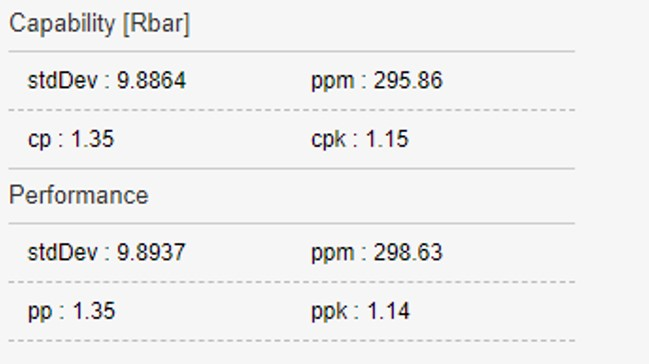
Filtering a Capability report
On the left side of the menu bar, click Analysis > Capability report.
On the upper-right corner of the Capability report workspace, click on the Filter button.
In the Capability report filters card, configure the available parameters.
If the Advanced statistical analysis licence is not active, the message Advanced statistical analysis feature not licensed is displayed in upper part of Capability report filters card.
On the upper-right corner of the Capability report filters card, click on Apply to create the capability report.
To save the selected filters of the capability report, click on Save as and type the filter name.
Editing a capability report filter
On the left side of the menu bar, click Analysis > Capability report.
On the upper-right corner of the Capability report workspace, click on the Filter button.
At the bottom of the Capability report filters card, select the filter to edit from the Selected filters drop-down list.
In the Capability report filters card, edit the parameters of the selected filter.
On the lower-right corner of the Capability report filters card, click on Save.
Capability report parameters
Inspections: add/remove the inspections to include in the report.
Click on the Search icon (
) to select the inspections.In the Inspection definitions workspace, select the inspections between Cm/Cmk, Cp/Cpk and SPC.
Then, click Apply.
Click on the Delete icon (
) to remove an inspection from the selected list.
The maximum number of inspections to select is 10.
Subgroup size (*): type the number of measures to include in the report.
The value can range from 1 to 25. The default value is 5.
Subgroup number (*): type the number of subgroups to include in the report.
The value can range from 1 to 100. The default value is 25.
Standard deviation estimator: from the drop-down list select between:
Rbar: it estimates sigma using the mean of the subgroup ranges.
Sbar: it is the average of the subgroup standard deviations.
Pooled: it is a weighted average of the subgroup standard deviations; the weighting gives larger groups a proportionally greater influence on the overall estimate.
Report graph limits
Torque custom limits: click on the switch to enable/disable the following parameters:
Torque lower limit (*): type the lower torque limit to include in the statistical analysis.
Torque upper limit (*): type the upper torque limit to include in the statistical analysis.
Angle custom limits: click on the switch to enable/disable the following parameters:
Angle lower limit (*): type the lower angle limit to include in the statistical analysis.
Angle upper limit (*): type the upper angle limit to include in the statistical analysis.
Dimension custom limits: click on the switch to enable/disable the following parameters:
Dimension lower limit (*): type the lower dimension limit to include in the statistical analysis.
Dimension upper limit (*): type the upper dimension limit to include in the statistical analysis.
Date range
The date range can be given as follows:
From - to: click to select the dates from the calendar.
Range: from the drop-down list, select between today, yesterday, last 7 days, last 30 days, this month, last month.
Click either the left or the right arrow to change the view of the date range.
Selected filter: from the drop-down list, select one of the saved capability report filters.
Items marked with an asterisk (*) are mandatory.
Exporting a Capability report
On the left side of the menu bar, click Analysis > Capability report.
On the upper-right corner of the Capability report workspace, click on the Filter button.
In the Capability report filters card, configure the available parameters or select an already configured filter.
On the upper-right corner of the Capability report filters card, click on Apply to create the Capability report.
On the upper-right corner of the Capability report workspace, click on the Report button.
A report file containing all information concerning the Capability report filtered are displayed.
The default report format is defined in the Application settings and in the Personal settings.
For information on the customization of the Capability report file, refer to Reports settings.
Gage R&R
On the left side of the menu bar, click Analysis > Gage R&R.
The methodology of Gage R&R (which stands for repeatability and reproducibility) is a statistical analysis used to measure the amount of variation due to the measurement system and the operators.
The Gage R&R allows to reduce the errors and to improve the quality of data by:
determining where the variation in the measurement takes place.
understanding the source of the variation.
predicting the percentage or probability of measurement error.
The Gage R&R analysis done in QA Supervisor is Crossed type. The statistical analysis is conducted to define the effectiveness of a measurement system. It can be used when more than one operator runs multiple times the test on the same part, and the object does not undergo variations during the measurements. In this case, multiple objects are measured multiple times by multiple operators randomly:
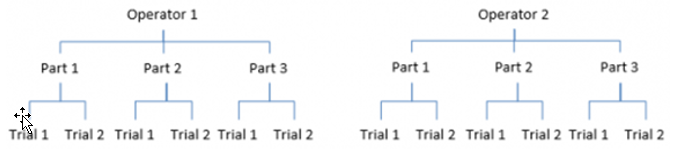
The most common statistical method employed to run this analysis is the 2-way anova test (Anova ANalysis Of VAriances).
Using QA Supervisor Crossed Gage R&R study, it is possible to assess the variation in the measurement system when at least two operators have run the same inspection at least two times.
Below an example of a Gage R&R Crossed analysis:
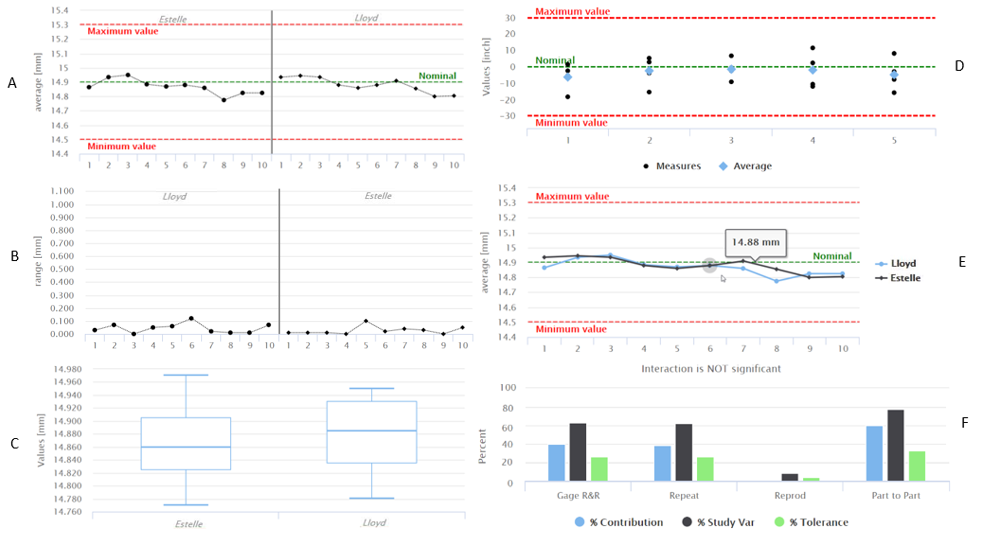
A - For each operator, the average values of the measurements done on a single part:
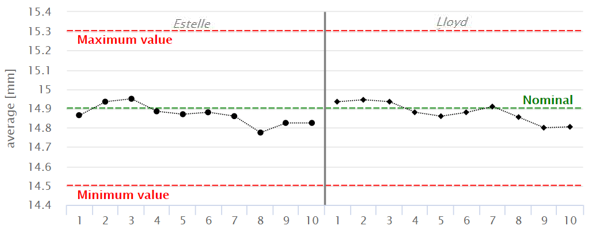
When the points fall within control limits, the operators measurements are consistent.
B - For each operator, the range of the measurements done on a single part:
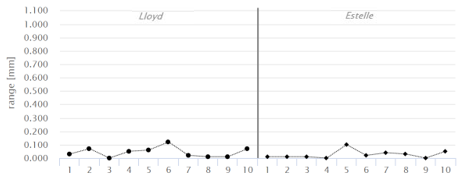
The smaller the range, the lower the variation of the measurement system.
C - For each operator, the distribution of the measurements done:
if the measurements done by each operator are less than 10, the individual value chart is generated:
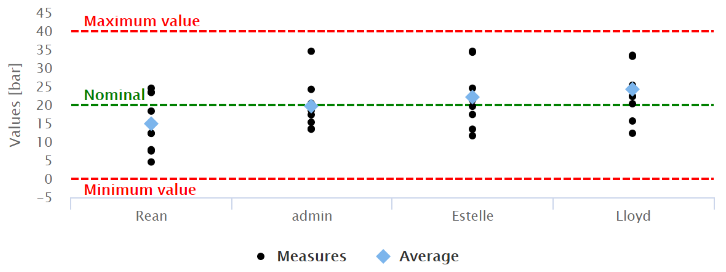
if the measurements done by each operator are more than 10, the boxplot is generated:
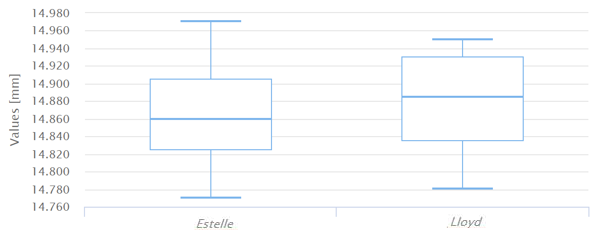
The amount of variation of the measurements for each operator should be equal.
D - For each part, the distribution of the measurements collected:
if the measurements on a single part are less than 9, the individual value chart is generated:
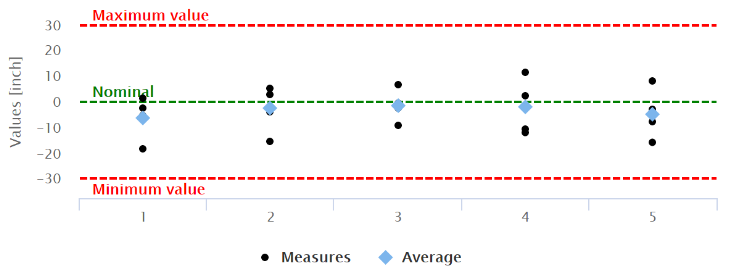
if the measurements on a single part are 9 or more, the boxplot is generated:
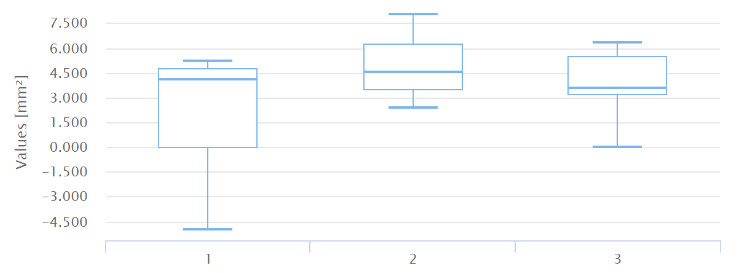
The measurement system has low variation when multiple measurements on same part have a minimal variation.
E - The differences between the averages of the measurements done on a single part by each operator:
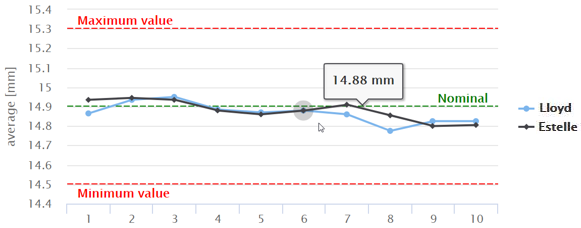
When lines coincide, the operators take similar measurements; when lines cross or are not parallel, the operator consistency depends on the part measured; when a line is higher or lower than the others, the operator affects the measurement by measuring consistently high or low.
F - The result of 2-way anova test (Anova ANalysis Of VAriances):
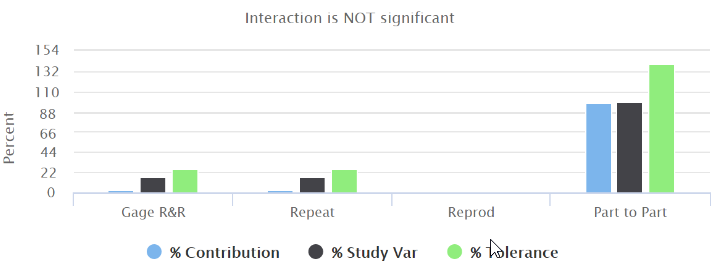
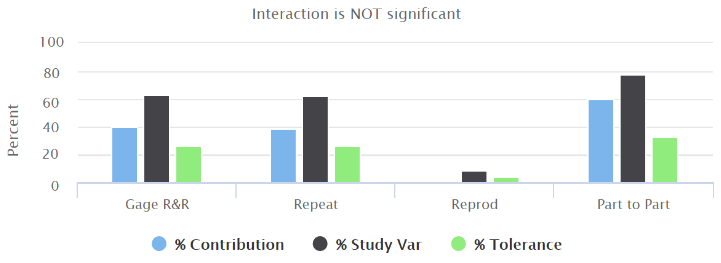
Gage R&R: shows that the variation is due to the different operators performing the test.
Repeatability (meaning the contribution of the measurement system - this component does not depend on the operators): shows that the variation is due to the same operator that measures the same part multiple times.
Reproducibility (meaning the contribution of the operators and the environmental conditions of the measurements): shows that the variation is due to the different operators that measure the same part.
Part to Part: shows that the variation is due to the different parts under test.
In an acceptable measurement system:
the largest %Contribution to the variability must be due to the Part to Part component.
If the repeatability %Contribution is high, you need to investigate the equipment used to perform for the test.
If the reproducibility %Contribution is high, you need to investigate how the operators perform the test.
As defined by the AIAG guidelines, the measurement system variability must be less than 10% of the total process variation.
If you want to assess process enhancement, %Study Var is a better approximation of measurement precision.
If you want to assess the capability of the parts compared to specification, %Tolerance is the proper estimation.
Filtering a Gage R&R report
On the left side of the menu bar, click Analysis > Gage R&R.
On the upper-right corner of the Gage R&R workspace, click on the Filter button.
In the Gage R&R filters card, configure the available parameters.
If the Advanced statistical analysis licence is not active, the message Advanced statistical analysis feature not licensed is displayed in upper part of Gage R&R filters card.
On the upper-right corner of the Gage R&R filters card, click on Apply to create the report.
To save the selected filters of the Gage R&R, click on Save as and type the filter name.
Editing a Gage R&R filter
On the left side of the menu bar, click Analysis > Gage R&R.
On the upper-right corner of the Gage R&R workspace, click on the Filter button.
At the bottom of the Gage R&R filters card, select the filter to edit from the Selected filters drop-down list.
In the Gage R&R filters card, edit the parameters of the selected filter.
On the lower-right corner of the Gage R&R filters card, click on Save.
Gage R&R parameters
Inspections: add/remove the inspections to include in the report.
Click on the Search icon (
) to select the inspections.In the Inspection definitions workspace, select the inspections between Cm/Cmk, Cp/Cpk and SPC.
Then, click Apply.
Click on the Delete icon (
) to remove an inspection from the selected list.
The maximum number of inspections to select is 10. For each inspection, a Gage R&R report is generated.
Date range
The date range can be given as follows:
From - to: click to select the dates from the calendar.
Range: from the drop-down list, select between today, yesterday, last 7 days, last 30 days, this month, last month.
Click either the left or the right arrow to change the view of the date range.
Exporting a Gage R&R report
On the left side of the menu bar, click Analysis > Gage R&R.
On the upper-right corner of the Gage R&R workspace, click on the Filter button.
In the Gage R&R filters card, configure the available parameters or select an already configured filter.
On the upper-right corner of the Gage R&R filters card, click on Apply to create the Gage R&R report.
On the upper-right corner of the Gage R&R workspace, click on the Report button.
A report file containing all information concerning the Gage R&R report filtered is created.
The default report format is defined in the Application settings and in the Personal settings.
CmCmk/CpCpk trend
On the left side of the menu bar, click Analysis > CmCmk/CpCpk trend.
Using CmCmk/CpCpk trend report, it is possible to:
monitor the evolution of the process;
evaluate the trend of each part by combining data from different inspections;
analyze how the process would have been with different control limits.
Below an example of a CmCmk/CpCpk trend report:
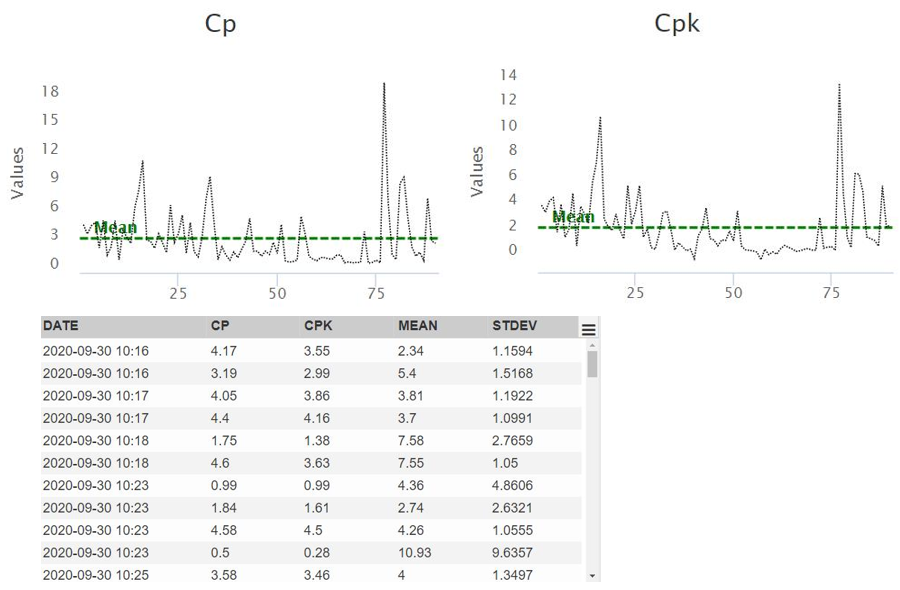
Filtering a CmCmk/CpCpk trend report
On the left side of the menu bar, click Analysis > CmCmk/CpCpk trend.
On the upper-right corner of the CmCmk/CpCpk trend workspace, click on the Filter button.
In the CmCmk/CpCpk trend filters card, configure the available parameters.
If the Advanced statistical analysis licence is not active, the message Advanced statistical analysis feature not licensed is displayed in upper part of CmCmk/CpCpk trend filters card.
On the upper-right corner of the CmCmk/CpCpk trend filters card, click on Apply to create the report.
To save the selected filters of the CmCmk/CpCpk trend, click on Save as and type the filter name.
Editing a CmCmk/CpCpk trend filter
On the left side of the menu bar, click Analysis > CmCmk/CpCpk trend.
On the upper-right corner of the CmCmk/CpCpk trend workspace, click on the Filter button.
At the bottom of the CmCmk/CpCpk trend filters card, select the filter to edit from the Selected filters drop-down list.
In the CmCmk/CpCpk trend filters card, edit the parameters of the selected filter.
On the lower-right corner of the CmCmk/CpCpk trend filters card, click on Save.
CmCmk/CpCpk trend parameters
Type (*): from the drop-down list, select the inspection type between:
Tool check
Joint check
Dimension
Inspections:
Click on the Search icon (
) to select the inspections.In the Inspection definitions workspace, select the inspections between Cm/Cmk, Cp/Cpk and SPC.
Then, click Apply.
Click on the Delete icon (
) to remove an inspection from the selected list.The maximum number of inspections to select is 10.
Number of samples (*): type the number of samples to include in the report.
The value can range from 3 to 1000.
Groups (*): type the number of groups to include in the report.
The value can range from 1 to 100.
Limits
Inspection to use (*): from the drop-down list, select the inspection to include in the analysis.
Torque custom limits: click on the switch to enable/disable the following parameters:
Torque lower limit (*): type the lower torque limit to include in the analysis.
Torque upper limit(*): type the upper torque limit to include in the analysis.
Torque custom limits parameters are displayed only for Tool check and Joint check inspections.
Angle custom limits: click on the switch to enable/disable the following parameters:
Angle lower limit (*): type the lower angle limit to include in the analysis.
Angle upper limit (*): type the upper angle limit to include in the analysis.
Angle custom limits parameters are displayed only for Tool check inspections.
Dimension custom limits: click on the switch to enable/disable the following parameters:
Dimension lower limit (*): type the lower dimension limit to include in the analysis.
Dimension upper limit (*): type the upper dimension limit to include in the analysis.
Dimension custom limits parameters are displayed only for Dimension inspections.
Date range
The date range can be given as follows:
From - to: click to select the dates from the calendar.
Range: from the drop-down list, select between today, yesterday, last 7 days, last 30 days, this month, last month.
Click either the left or the right arrow to change the view of the date range.
Exporting a CmCmk/CpCpk trend report
On the left side of the menu bar, click Analysis > CmCmk/CpCpk trend.
On the upper-right corner of the CmCmk/CpCpk trend workspace, click on the Filter button.
In the CmCmk/CpCpk trend filters card, configure the available parameters or select an already configured filter.
On the upper-right corner of the CmCmk/CpCpk trend filters card, click on Apply to create the CmCmk/CpCpk trend report.
On the upper-right corner of the CmCmk/CpCpk trend workspace, click on the Report button.
A report file containing all information concerning the CmCmk/CpCpk trend report filtered is created.
The default report format is defined in the Application settings and in the Personal settings.
Tool Swap
A tool swap operation allows the easy replacement of a tool on the production line.
Through a series of guided steps, it is possible to select the best replacement tool by migrating the data from the tool currently in use. During the operation, the software performs a pre-validation of the data and shows the user what the final result would be. At the end of the procedure, the inspections previously defined on the tool to replace are created on the replacement tool, while the routes involved are updated with the new inspections defined on the replacement tool.
The Tool Swap page lists the tool swap operations performed on tools that are currently available to the logged-in user.
On the left-side menu bar, click on Tool Swap.
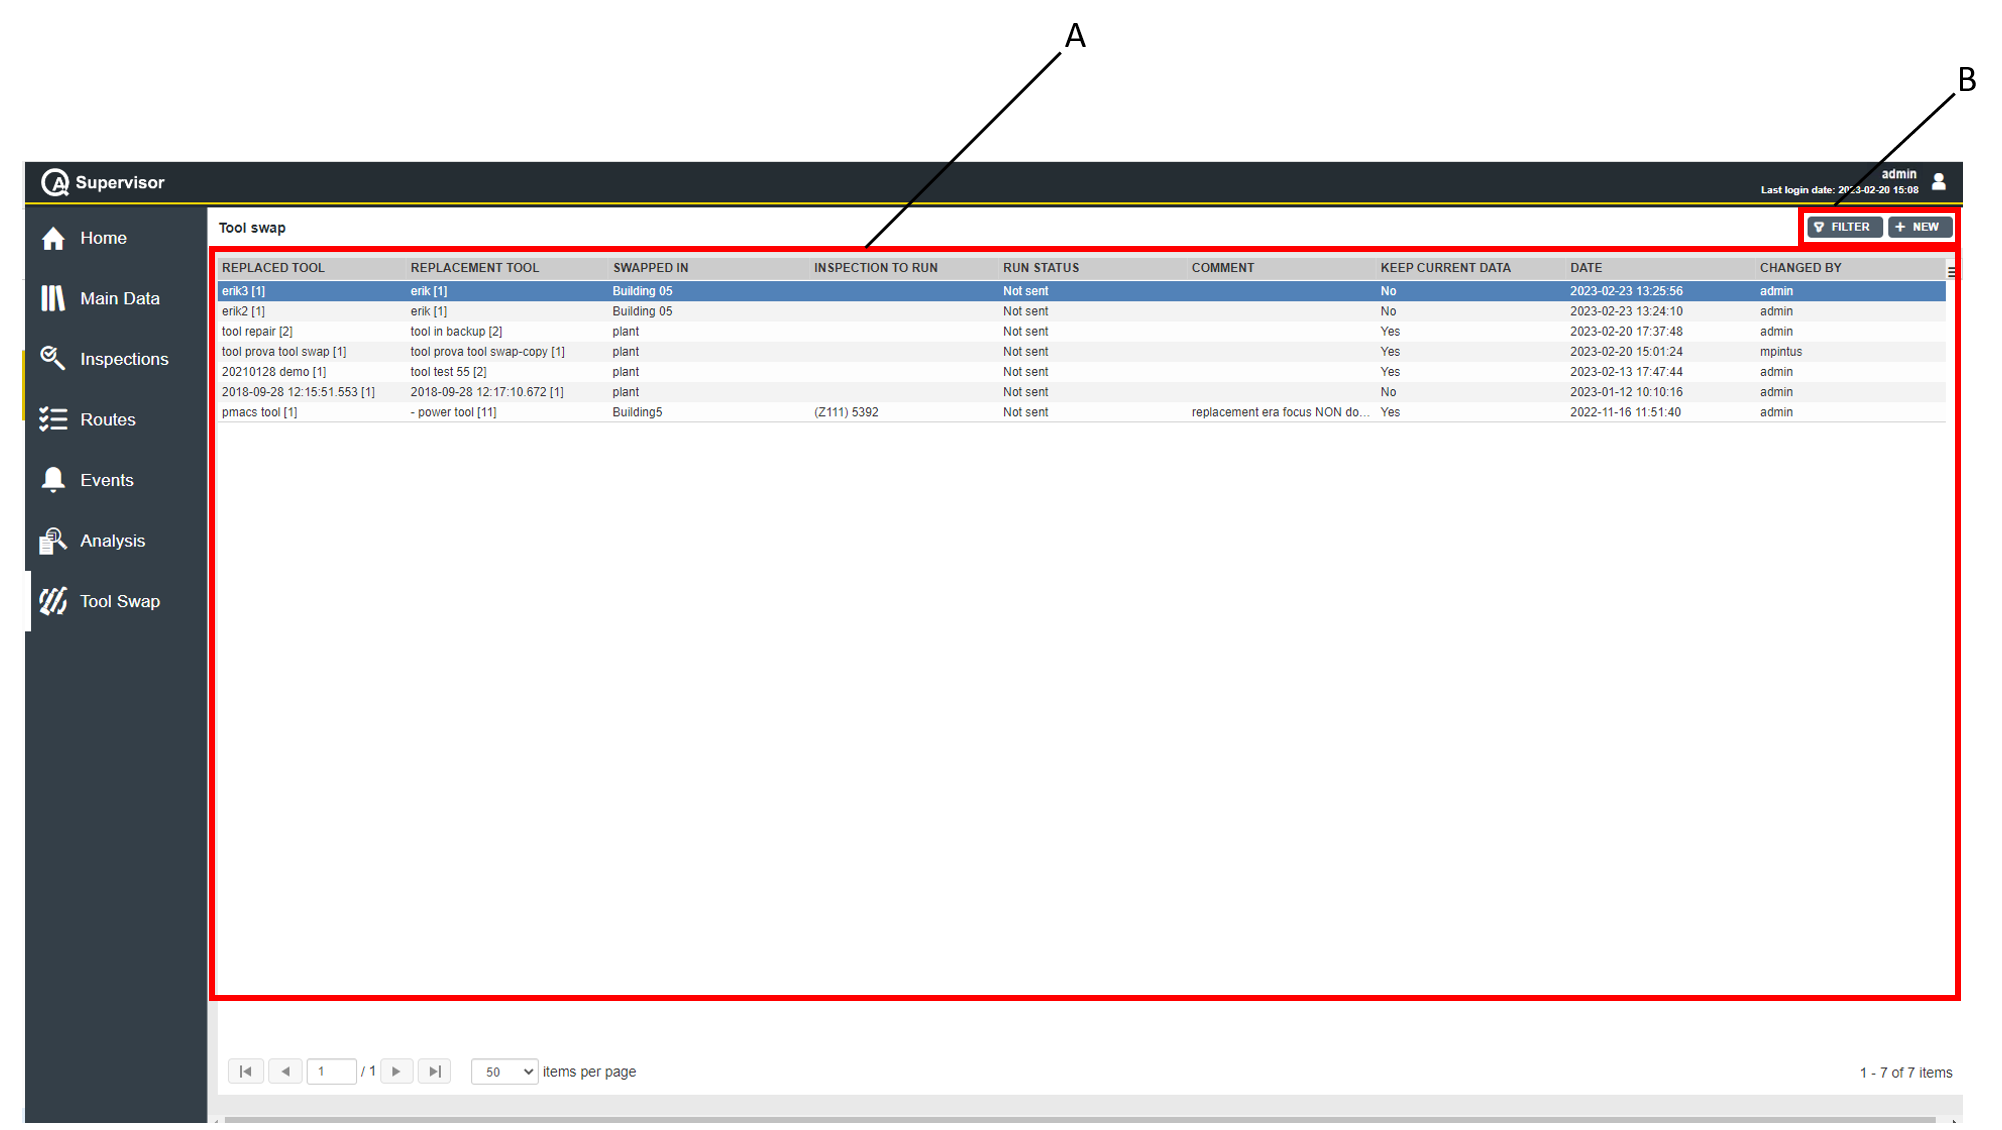
A | Tool Swap workspace | B | Command buttons |
The Tools Swap workspace is divided into the following columns:
Replaced tool: name of the tool that has been replaced through the tool swap operation.
Replacement tool: name of the tool that replaced the previous one through the tool swap operation.
Swapped in: location where the tool swap operation has been performed.
Inspection to run: name of the inspection sent to the replacement tool at the end of the tool swap operation.
Run status: status of the inspection sent to the replacement tool at the end of the tool swap operation. Below are the available options, depending on the status of the inspection:
Sent: the inspection has been successfully sent to the replacement tool.
Not Sent: the inspection failed to be sent to the replacement tool.
Comment: comment left by the user performing the tool swap operation.
Keep current data: status of the data linked to the replacement tool. Below are the available options, depending on the status of the data:
Yes: the replaced tool's joints, controllers and inspections have been merged with the ones already linked to the replacement tool.
No: only the replaced tool's joints, controllers and inspections are now linked to the replacement tool.
Date: tool swap operation date and time.
Changed by: name of the user who performed the tool swap operation.
On the upper-right corner of the Tools Swap workspace, there are the following command buttons:
New: click to perform a new tool swap operation.
Filter: click to give filters and list only the tool swap operation(s) of interest.
In the Tools Swap workspace, click a tool swap to display the related Tool Swap Operation Details card.
On the Tool Swap Operation Details card, a detailed overview of the selected Tool Swap operation is available, listing the following items:
Replaced tool:
Tool: name of the replaced tool.
Version: version of the tool configuration.
Status: tool current status.
Location: area of the plant where the tool is in use.
Replacement tool:
Tool: name of the tool.
Version: version of the tool configuration.
Status: tool current status.
Location: area of the plant where the tool is in use.
Parameters:
Keep current data: status of the data linked to the replacement tool.
Confirmation text: message informing on the status of the replacement tool at the end of the tool swap operation.
Inspection to run: name of the inspection sent to the replacement tool at the end of the tool swap operation.
Run status: status of the inspection sent to the replacement tool at the end of the tool swap operation.
Comment: comment left by the user performing the tool swap operation.
History:
Date: date and time of the selected tool swap operation.
Changed by: name of the user who performed the tool swap operation.
On the upper-right corner of the Tool Swap Operation Details card, click the Close button to exit the Tool Swap Operation Details card.
Performing a tool swap operation
In order to successfully perform a tool swap operation, a Tool Swap license must be activated.
Only roles with tool swap rights can perform a tool swap operation.
For more information on how to manage roles, refer to Roles.
On the left-side menu bar, click Tool Swap.
On the upper-right corner of the Tool Swap workspace, click New.
In the New Tool Swap Operation dialog box, configure the new tool swap operation parameters.
For further information, refer to New tool swap operation parameters.
On the upper-right corner of the New Tool Swap Operation dialog box, click Check to run a preliminary validation of the tool swap.
The Tool Swap Operation Preview dialog box displays a report of the preliminary validation, showing the compatibility of joints and inspections to be linked to the replacement tool.
In their respective list, joints and/or inspections that are not compatible with the replacement tool are highlighted with a red bar and matched with an error message.
If the error message is not fully visible, click on the respective raw and the full text will be displayed under the relevant list.If you wish to continue with the tool swap operation, click Proceed on the upper-right corner of the Tool Swap Operation Preview dialog box.
If the tool swap preliminary validation detected incompatibilities, a dedicated Tool swap operation confirmation dialog box is displayed, showing the following warning message:
Some incompatibilities have been detected for the ongoing tool swap, do you want to proceed?
Click Yes to proceed.In the Tool swap operation confirmation dialog box, the following items are displayed:
Status message: message informing on the current status of the replacement tool. Depending on the replacement tool status, the following messages are displayed:
There are no inspections defined on the replacement tool.
All inspections defined on the replacement tool are OK and not expired.
All inspections defined on the replacement tool are OK but at least one of them is expired.
There are not NOK results for the inspections defined on the replacement tool but at least one of them has never been run.
All inspections defined on the replacement tool are NOK.
At least one inspection defined on the replacement tool is NOK.
There are no results for the inspections defined on the replacement tool.
Unable to determine the current status. Please check manually.
Inspection to RUN: in the drop-down list, select the inspection to send to the replacement tool.
To be able to select an inspection to RUN, the user must first define a measuring device in its personal settings. For further information, refer to Viewing/editing personal settings.
Comment: in the box you can leave a comment relevant to the tool swap operation.
Click Confirm to complete the tool swap operation.
New tool swap operation parameters
Items marked with an asterisk (*) are required.
Tool to replace
Tool (*): select the tool to replace.
Click Search icon () to select the tool to replace.
In the Tools workspace, select the tool to replace.
Then, click Apply.Next status (*): select from the drop-down list the status to assign to the tool to replace. The options are the following:
Use replacement tool: the tool must not be used on the assembly line. Use the respective replacement tool instead.
In use: in working condition and currently used in production applications
Backup: the tool is not currently used but it is ready to replace an operating tool on the assembly line.
Toolcrib: the tool is stored in the toolcrib. It is waiting for the assignment to a production location depending on the incoming production needs. Do a tool check before a regular usage on the assembly line.
Service/Repair: the tool cannot be used on the assembly line before maintenance is complete. The capability of the tool is verified according to customer’s procedures.
Scrapped/Disabled: the tool is out of order. Do not use it on the assembly line.
Additional statuses already configured by the user in the Application settings page.
The user can configure a default status for the tool to replace in the Application settings page. For further information, refer to Viewing/editing application settings.
If any status other than In use, Backup and Toolcrib is assigned to the tool to replace, joints and controllers linked to the tool will be removed, and the inspections will be disabled.
Current Location: area of the plant where the tool to replace is currently in use. This parameter is automatically filled in after selecting the tool.
Torque range: torque range of the tool to replace. This parameter is automatically filled in after selecting the tool.
Joints: list of the joints linked to the tool to replace. This parameter is automatically filled in after selecting the tool.
Inspections: list of the inspections defined for the tool to replace. This parameter is automatically filled in after selecting the tool.
Replacement tool
Tool (*): add/select the replacement tool.
Do one of the following:Click Add icon (
) to add a new replacement tool.
In the Add Tool dialog box, enter the details related to new replacement tool.
Then, click Save.Click Search icon (
) to select the a replacement tool already configured.
In the Tools workspace, select the replacement tool.
Then, click Apply.
In the Tools workspace, the list of potential replacement tools is automatically filtered accordingly to the following criteria:
Torque range: only tools with a torque range overlapping the one of the tool to replace are shown in the list. This criterion is not editable.
Operating principle: only tools with the same operating principle (e.g.: continuos, pulse, stroke) as the one of the tool to replace are shown in the list. This criterion is not editable.
Status: by default, only tools in Backup or Toolcrib status are shown in the list.
Model: by default, only tools with the same model name as the one of the tool to replace are shown in the list.
Manufacturer: by default, only tools from the same manufacturer as the one of the tool to replace are shown in the list.
To modify the editable filter criteria, click Filter on the top of the Tools workspace and proceed with editing the criteria in the Tools Filter dialog box.
Next status (*): select from the drop-down list the status to assign to the replacement tools. The options are the following:
In use: in working condition and currently used in production applications
Backup: the tool is not currently used but it is ready to replace an operating tool on the assembly line.
Toolcrib: the tool is stored in the toolcrib. It is waiting for the assignment to a production location depending on the incoming production needs. Do a tool check before a regular usage on the assembly line.
Current Location: area of the plant where the replacement tool is currently in use. This parameter is automatically filled in after selecting the tool.
Torque range: torque range of the replacement tool. This parameter is automatically filled in after selecting the tool.
Joints: list of the joints already linked to the replacement tool. This parameter is automatically filled in after selecting the tool.
Inspections: list of the inspections already defined for the replacement tool. This parameter is automatically filled in after selecting the tool.
Keep current data: this parameter determines whether joints, controllers and inspections currently linked to the replacement tool must be kept or not after the tool swap operation. Below are the available options:
Enabled: joints, controllers and inspections remain linked to the replacement tool without undergoing any changes .
Disabled: (default value) joints and controllers are unlinked from the replacement tool, and all the inspections defined for the tool are disabled.
Setting the Tool Swap filter
On the left-side menu bar, click Tool Swap.
On the upper-right corner of the Tool Swap workspace, click Filter.
In the Swap Filter dialog box, set the tool swap filter criteria (depending on the customer needs).
On the upper-right corner of the Swap Filter dialog box, click Apply.
Tool Swap filter criteria
Tool data: type the relevant data for the tool to be filtered such as name, serial number, identifier.
Replaced tool: in the Replaced tool box, select the replaced tool to be filtered.
To select a replaced tool, click Search icon (
).In the Tools workspace, select the replaced tool of interest. Then, click Apply
To delete a replaced tool in the Replaced tool box, select it. Then, click Delete icon (
).Replacement tool: in the Replacement tool box, select the replacement tool to be filtered.
To select a replacement tool, click Search icon (
).In the Tools workspace, select the replacement tool of interest. Then, click Apply
To delete a replacement tool, in the Replacement tool box, select it. Then, click Delete icon (
).Current tool location: in the Current tool location box, select the location to be filtered.
To select a Current tool location, click Search icon (
).In the Location workspace, select the location of interest. Then, click Apply.
To delete a location, in the Current tool location box, select it. Then, click Delete icon (
).Comment: type the comment to be filtered.
Changed by: type the name of the user who performed the operation(s) of interest.
Run status: from the drop-down list, select the status to be filtered of the inspection sent to the replacement tool at the end of the tool swap operation. Below are the available options:
Sent: filter the tool swaps in which the inspection has been successfully sent to the replacement tool.
Not Sent: filter the tool swaps in which the inspection failed to be sent to the replacement tool.
Both: show the tool swaps regardless of the outcome of the inspection's sending.
Date range: filter the operations date range.
Do one of the following:
From - to: click the box: a calendar opens. Select the date from the calendar.
Click Delete icon (
) to delete a date already configured.Range: in the Range drop-down list, select a specific time interval.
Selected filter: from the drop-down list, select one of the saved customized filter.
For more information on how to manage customized filters, refer to Filters customization.
Notes
Exporting data
Open the page/card with the table to export.
On the upper-right corner of the page/card, click the Export icon (
 ).
).In the Export menu, select Export all data as csv.
.csv file is generated.
This functionality is present in all the pages and cards of the application where a table is shown, with the exception of the Sent inspections card.
Only the data shown in the page /card are exported.
Disabling the application entities
To preserve the data traceability, entities in QA Supervisor cannot be deleted.
By opening the Edit page of each entity in QA Supervisor, it is possible to disable it. Disabled data can be retrieved by changing the Status filter.
Table customization
QA Supervisor pages can be customized according to some user preferences. The customization is saved and restored each time QA Supervisor is started and can be changed at any time.
The preferences saved are:
order and size of columns;
number of rows to display;
sorting of data.
Filters customization
For each page of the QA Supervisor, it is possible to save one or more customized Filters:
From the menu bar on the left side of the window, select the page to filter.
On the upper-right corner of the page, click on the Filter button.
In the Filter dialog box of the selected page, set the necessary filter criteria.
In the lower part of the Filter dialog box, click on the Save as button.
In the dialog box that opens, type the name of the Filter.
Then, click on the Save button.
The Filter is stored and displayed in the Selected filter drop-down list.
It is not allowed to save two Filters with the same name.
To remove a Filter:
From the Selected filter drop-down list, select the Filter to remove.
Click on the Remove button to delete the Filter.
To modify the filter criteria of a Filter:
From the Selected filter drop-down list, select the Filter to modify.
Make the necessary changes.
Click on the Save button to store the new filter criteria of the Filter.
By clicking on the Save as button, a new Filter is created: in the dialog box that opens, type the name of the new Filter and click on the Save button.
References
Advanced parameters for tool check inspections
Below are the advanced parameters for the Power tools (strategy: Direct driven):
Cycle start
Cycle complete
Filter frequency
Measure torque at
Measure delay time
Reset time
End cycle time
Number of free rounds
In the Add Inspection Definition dialog box - JSB, enter the following items:
JSB test type: select one of the following option: generic power tool, dual step, and quick step.
Angle first step: type the angle value of the first step of the test.
First speed: type the value of the speed of the first step. The value is express in rpm.
Second speed: type the value of the speed of the second step. The value is express in rpm.
End first step: type the torque value t the end of the first step. The value is express with the selected measurement unit.
Pause: type the duration of the pause between the two steps. The value is express in ms.
All the values listed above are available if JSB test type is set to Dual step or Quick step.
Below are the advanced parameters for the Power tools (strategy: Only angle):
The strategy Only angle is available only for Power tools and check type Only angle.
Filter frequency (*)
End cycle time (*)
Below are the advanced parameters for the Type I - Indicating torque tools (strategy: Peak):
Cycle start
Filter frequency
End cycle time
Relaxation time
Below are the advanced parameters for the Type II - Setting torque tools (strategy: Click wrench):
Cycle start
Cycle complete
Filter frequency.
Slip torque
Measure delay time
Reset time
End cycle time
Below are the advanced parameters for the Type II - Setting torque tools (strategy: Cam-over):
Cycle start
Filter frequency
End cycle time
Below are the advanced parameters for the Pulse tools (strategy: Pulse):
Cycle start
Filter frequency
Torque correction coefficient
Use tool model torque correction coefficient
Torque threshold
Min pulse
Max pulse
End cycle time
Below are the advanced parameters for the Pulse tools (strategy: ACTA pulse):
Cycle start
Cycle complete
Filter frequency
Min pulse
Max pulse
Measure delay time
Reset time
Advanced parameters for Joint check inspections
Strategy: residual torque/angle
Cycle start: the cycle start is the starting point of the test.
It must be higher than the transducer Minimum Load and equal/lower than the final angle monitoring torque.
The default value is 0 N·m.
Ratchet time (*): type the value of the ratchet time.
Change screw (*): type the value of the change screw.
Final angle monitoring torque (*): type the value of the final angle monitoring torque.
Residual angle threshold (*): type the value of the residual angle threshold.
Breakaway angle threshold (*): type the value of the breakaway angle threshold.
Torque correction coefficient (*): type the value of the torque correction coefficient.
Angle correction (*): type the value of the angle correction.
Strategy: residual torque/peak
Cycle start: type the value of the cycle start.
It must be higher than the transducer Minimum Load and equal/lower than the final angle monitoring torque.
The default value is 0 N·m.
Ratchet time (*): type the value of the ratchet time.
Change screw (*): type the value of the change screw.
Final angle monitoring torque: type the value of the final angle monitoring torque.
Angle target: type the value of the target angle.
Torque correction coefficient (*): type the value of the torque correction coefficient.
Angle correction (*): type the value of the angle correction.
Strategy: Loose and tightening
The Loose and Tightening strategy is available only with STa 6000.
Cycle start: type the value of the cycle start.
It must be higher than the transducer Minimum Load
The default value is 0 N·m.
Change screw (*): type the value of the change screw.
Angle target: type the value of the target angle.
Torque correction coefficient (*): type the value of the torque correction coefficient.
Angle correction (*): type the value of the angle correction.
Scheduling by time operation
When a scheduling is associated to an inspection, the expiry date of the test is calculated in the following way:
If the inspection has never been done: the expiry date is the date of the creation of the inspection.
if the inspection result is completed and there is already an existing expiry date, the following cases could verify.
Defining:
the current date as the date of the test
first recurring date as the first occurrence date according to scheduling
second recurring date as the second occurrence date according to scheduling
interval_1 = (first recurring date) – (current date)
interval_2 = (second recurring date) - (first recurring date)
the two cases are:
interval_1 < 50% of interval_2, the new expiry date is set to second recurring date
interval_1 => 50% of interval_2, the new expiry date is set to first recurring date
In the following table, some other examples of how the scheduling works.
Scheduling frequency | Last result date | Expiry date |
Yearly: on 7 May | 5 May 2018 | 7 May 2019 |
7 May 2018 | 7 May 2019 | |
9 May 2018 | 7 May 2019 | |
Monthly: every 1 month on day 7 | 5 May | 7 June |
7 May | 7 June | |
9 May | 7 June | |
30 May | 7 July | |
1 June | 7 July | |
Weekly: every 1 week on Monday and Thursday | Sunday 2 | Monday 6 |
Monday 3 | Thursday 17 | |
Tuesday 4 | Thursday 17 | |
Thursday 6 | Monday 17 | |
Friday 7 | Monday 17 | |
Weekly: every 3 week on Monday and Thursday | Sunday 2 | Monday 17 |
Monday 3 | Monday 24 | |
Tuesday 4 | Monday 24 | |
Thursday 6 | Monday 24 | |
Friday 7 | Monday 24 |
If a scheduling is linked to a working calendar, the Expiry date of the inspection is calculated considering the working and non-working days set in the calendar.
The scheduling linked to a By part inspection is not affected by NOK results. The new expiry date is calculated starting from the execution date.
Tool types
The available tool types are:
Peak wrench: hand-operated tools, defined as displaying torque wrench (type I) in the ISO 6789 standard
Click wrench: hand-operated tools, defined as breakaway torque wrench (type II) in the ISO 6789 standard
Power tool: continuously rotating tool that provides real torque to the joint, like battery tools, pneumatic tools (not impulse) and electronic controlled tools
Pulse tool: tool that provides a series of pulses to tighten the joint.
Tool check testing
In the following a description of the parameters that characterized the strategies available for the tool testing.
Click strategy
Click strategy
This strategy is applicable to a click wrench with breakaway technology with one breakaway point, defined as setting torque tools (type II and class A, C, G, B by standard ISO 6789)
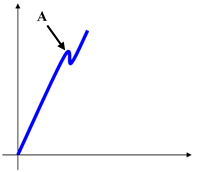
A | Click point |
The click-point is detected when the torque drops and then increases again, as shown in the two following examples:
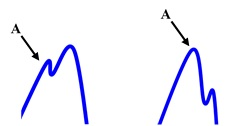
A | Click point |
If the torque drops to zero without increasing again after a peak point, the peak point is not detected as click point. For this reason, slip-wrenches cannot be tested with this method (the slip-wrenches should be tested with the Peak Wrench or Cam-over strategies):
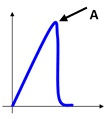
A | Point not detected as click point |
If the test ends and the click-point is not detected, a message Not detected is shown at the bottom-left area of the display. In that case the result is the torque absolute peak.
The parameters that characterize the click point detections are:
Measure delay time: this timeout is used to filter the possible spikes or noise at low torque values. When the torque reaches the Cycle Start value, the timer starts. During this time the torque trace is not analyzed and the click point is not searched.
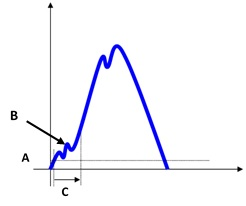
Torque vs time A
Cycle start
B
Ignored point
C
Measure delay time
Reset time: this timeout is used to filter the possible spikes/bounces after the click-point. When the torque goes below the cycle complete value, the timer starts. During this time the torque trace is not analyzed (any click-point possibly occurring during the reset time is not considered). This timeout can be used when the click-wrench produces such spikes-bounces after the click-point.
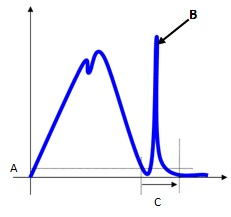
A
Cycle complete
B
Ignored point
C
Reset time
End cycle time: this timeout defines the end of the test. When the torque goes and remains below the Cycle Complete for the given timeout, the test ends. The test ends when torque remains under the cycle complete load for the timeout (torque during the reset time is ignored).
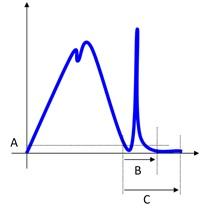
Torque vs time A
Cycle complete
B
Reset time
C
End cycle time
Slip Torque: The slip torque gives the requested drop in torque after the click-point. If the torque drops more than the slip torque, the peak value is considered as click-point; if not, the peak value is ignored.
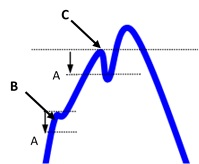
A
Slip torque
B
Torque drops less than the slip torque → the peak is ignored
C
Torque drops more than the slip torque → the peak is a click-point result
However, it is possible to give the slip torque manually. This option is useful in case the click-point is not detected when the slip torque is set to Automatic. In this case do the following procedure: do some tests and make an analysis by looking at the traces. Then, select the proper value in order to detect the click-point.
Suggestions: Setting this value too low increases the risk of detecting a false click-point, while setting this value too high increases the risk of not detecting the real click-point. The best trade-off can be figured out only looking at the characteristics of the specific click-wrench under test.
Cam-over strategy
This strategy is applicable to a wrench or screwdriver with clutch technology that "slips-free" when the set torque is reached, preventing under and over tightening.
The click wrenches with clutch technology are defined as setting torque tools (Type II by standard ISO 6789).
The slip-wrench test provides the maximum torque measured during the test.
The parameter that characterize the peak point detections is:
End cycle time: it defines the end of the test. When the torque goes and remains below the transducer minimum load (which is normally the 5% of the transducer full scale) for the given timeout, the test ends.
If the torque goes over transducer minimum load before the timeout, the test continues. The test ends when torque remains under the transducer minimum load for the timeout.
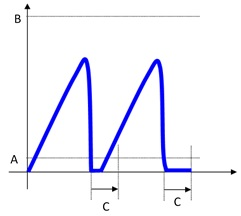
Torque vs time A
Transducer min load
B
Transducer full scale
C
Timeout
Peak strategy
This strategy is applicable to a peak wrench, defined as indicating torque tools (type I by standard ISO 6789).
The peak wrench test provides the maximum torque measured during the test.
The parameters that characterize the peak point detections are:
End cycle time: it defines the end of the test. When the torque goes and remains below the transducer minimum load (usually 5% of the transducer full scale) for the given timeout, the test ends.
If torque goes over transducer minimum load before the timeout, the test continues. The test ends when torque remains under the transducer minimum load for the timeout.Torque vs time A
Transducer min load
B
Transducer full scale
C
End cycle time
Relaxation time + End cycle time: due to the mechanical relaxation of the wrench, the torque peak detected by the wrench slightly decreases after a short time interval. The relaxation time allows to adjust the peak detection in case of wrenches that do not save the torque peak, thus reducing discrepancies between the transducer and the wrench torque peak detections. If Relaxation time > 0, the End cycle time starts when the Relaxation time expires.
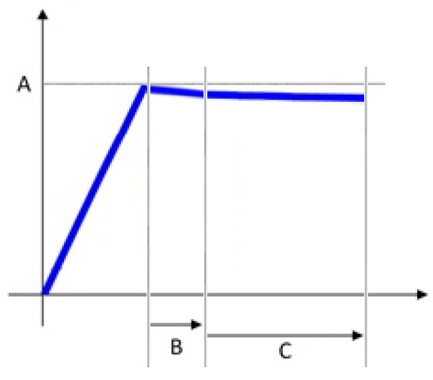
Torque vs time A
Torque peak
B
Relaxation time
C
End cycle time
Direct driven strategy
For power tool test, the torque result is the peak value measured during the test.
In case of multiple peaks, the result is the highest peak.
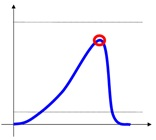
Testing the tool with a torque/angle transducer makes possible to define a torque/angle window in which the result is OK.
The parameter that characterize the peak point detections are:
Measure delay time: this timeout is used to filter the possible spikes or noise at the beginning of the test. When the torque reaches the Cycle Start value, the timer starts. During this time the torque trace is not considered.
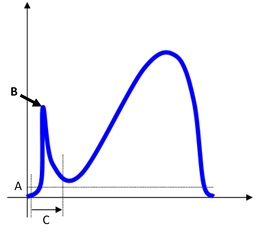
Torque vs time A
Cycle start
B
Ignored point
C
Measure delay time
Reset time: this timeout is used to filter the possible spikes/bounces after the tool clutch release the torque. When the torque goes below the cycle complete value, the timer starts. During this time the torque trace is not considered.
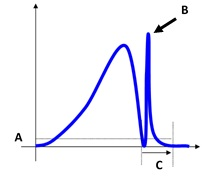
Torque vs time A
Cycle start
B
Ignored point
C
Reset time
This timeout can be used in those cases where the power tool produces such spikes-bounces at the end of the test.
End cycle time: this timeout defines the end of the test. When the torque goes and remains below the Cycle Complete for the given timeout, the test ends.
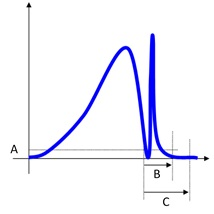
Torque vs time A
Cycle complete
B
Reset time
C
End cycle time
The Cycle Complete must be equal or less than the Cycle Start. The value of the End cycle time must be equal or greater than the Reset time value.
Measure angle from
Below an example of a complete curve in which the measurement of the angle starts as soon as the torque reading starts, to be compared with the curves representing the angle measured from One step/Second step/Starting second step:
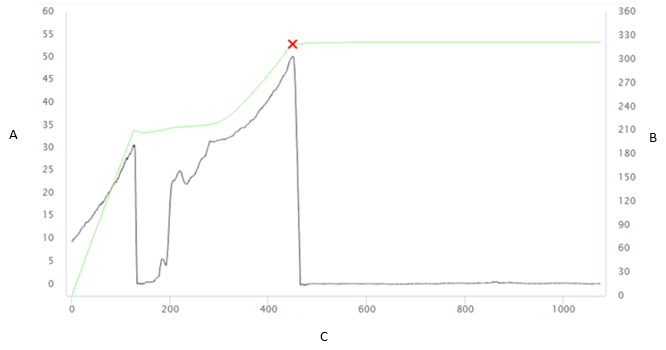
A | Torque [Nm] | B | Angle [°] |
C | Time [ms] |
One step: the measurement of the angle starts as soon as the Final monitoring torque value is reached.
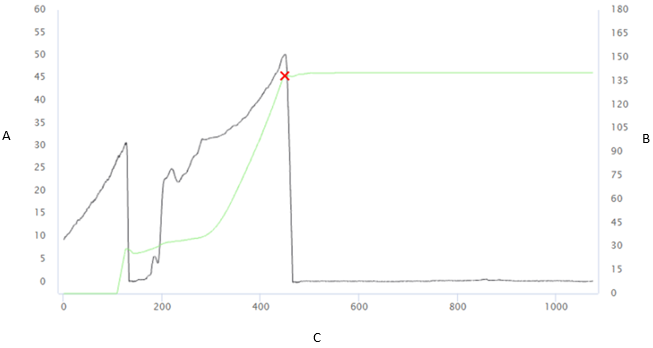
A | Torque [Nm] | B | Angle [°] |
C | Time [ms] |
Second step: the measurement of the angle starts in the second step, when the Final angle monitoring torque value is reached.
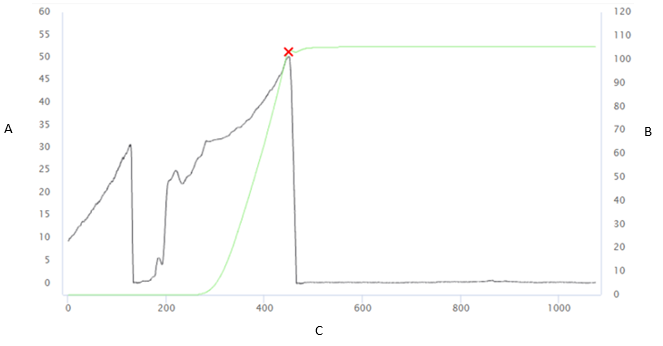
A | Torque [Nm] | B | Angle [°] |
C | Time [ms] |
Starting second step: the measurement of the angle starts at the starting of the second step.
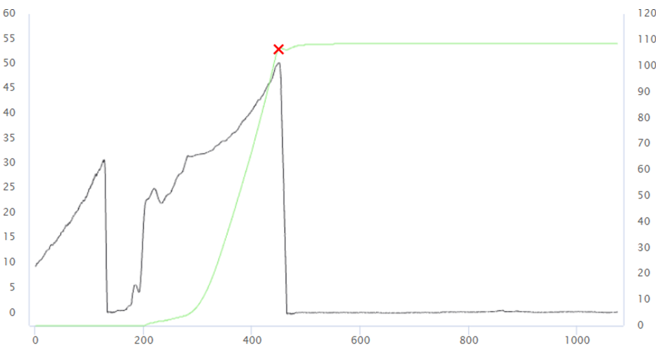
A | Torque [Nm] | B | Angle [°] |
C | Time [ms] |
Only angle strategy
This strategy is available for the power tools.
It is possible to make a specific test to verify the angle of a tool.
Suggestion: In this case the Final angle monitoring torque defines the torque value from which the angle is measured. Leave it to zero to measure the angle without applying any torque.
Pulse strategy
To calculate the tool frequency, the Pulse Tool strategy uses a configurable threshold to identify a peak.
The parameter that characterize the peak point detections are:
End cycle time: when the torque goes and remains below the transducer minimum load (which is normally the 5% of the transducer full scale) for the given time, the test ends.
Timeout can be set from 0.1 s up to 5 s. The default value is 0.4 s.
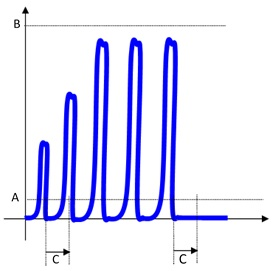
Torque vs time A
Transducer min load
B
Transducer full scale
C
End cycle time
Torque coefficient: Pulse tools do not provide a continuous torque output, but they generate single high energy pulses of very short duration (» 1ms). This series of pulses results in the tightening of a joint. Due to the physics of the tool the final torque reached cannot be measured directly as for real torque tools. The reason for this is that pulse tools provide a very high torque for such a short time that only a part of these peaks translates into the tightening of the joint (generating more clamping force). This depends on many factors such as the bolt mass, friction, the stiffness of the joint, etc... The torque coefficient can be used to align the torque measured by the transducer with the real torque produced on the joint. The torque produced on the real joint will be always smaller (ideally equal) than the peak torque measured on the transducer. Therefore, this coefficient can be set to values between 0.1 and 10.
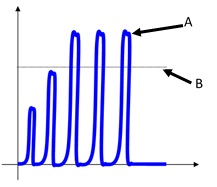
Torque vs time A
Peak value measured on the torque transducer
B
Actual torque measured on the joint
The only way to evaluate the actual torque is to make a residual torque check on the real joint (for instance, by using a STwrench). The relation between the peak torque measured on the transducer and the actual torque on the joint is affected by all the components: The pulse tool, the adapters, the transducer and the joint itself. If any of these components is changed, the relation peak torque – actual torque should be recalculated.
The following process should be used to adjust the pulse tool in order to provide the desired torque on the real joint and to calculate the proper coefficient K:
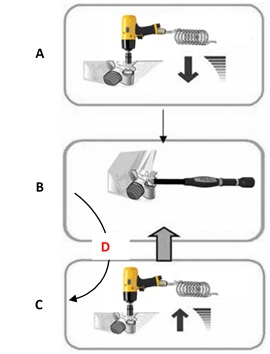
A
Set a value torque
B
Check the residual torque
C
Slightly increase torque
D
Too low
For instance, assume a target torque for the joint of 100 Nm, and after the tool regulation the residual torque check gives 100 Nm; if the torque measured on the transducer is 120 Nm, in that case the coefficient is 100/120 = 0.83.
Threshold: it is used to filter the trace for proper peak detection for the frequency calculation. After each peak is detected, all the values under the threshold are discarded. This filters all the bounces always present in a pulse tightening.
The threshold can be set from 1 to 99 %. The default value is 80%.
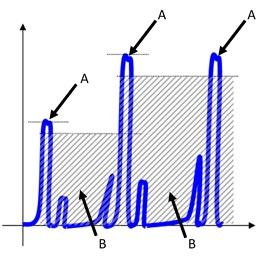
Torque vs time A
Peak
B
Bounce
ACTA pulse strategy
To calculate the tool frequency, the ACTA Pulse Tool strategy uses a set of timers and recalculates the Cycle Start dynamically each time a peak is measured (the Cycle Start is set to the last peak value divided by 1.5).
The parameters that characterize the ACTA pulse strategy are:
Measure delay time: when the torque goes over the cycle start value, the torque is ignored during this Measure delay time. This can be helpful to exclude noise and “false pulses” at the low torque values. The timeout can be set from 0 s up to 5 s. The default value is 0 s (no delay applied).
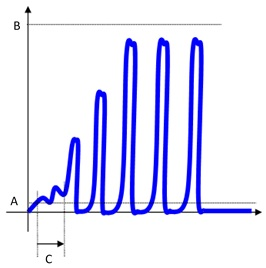
Torque vs time A
Cycle start
B
Transducer full scale
C
Measure delay time
Reset time: after each peak, the reset time defines a time during which the STa 6000 / STa 6000 Plus does not consider the torque trace. This can be helpful in order to avoid considering as two real peaks the real peak and the bounces possibly produced by the peak itself.
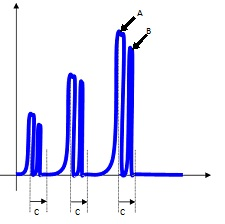
Torque vs time A
Peak
B
Bounce
C
Reset time
The value of this parameter depends on the frequency of the pulse tool and on the bounces possibly present in the trace. The timeout can be set from 0 s up to 5 s. The default value is 0 s (no reset time applied).
End cycle time: when the torque goes and remains below the Cycle complete for the end cycle time, the test ends.
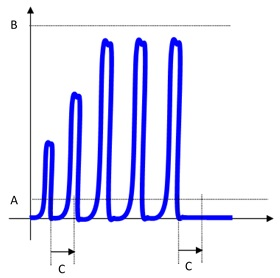
Torque vs time A
Cycle complete
B
Transducer full scale
C
End cycle time
Joint check testing
The quality control strategies are used to check tightening operations already performed, by executing the residual torque check operation.
In the following a description of different strategies.
Residual Torque/Angle
This strategy evaluates the residual torque on a joint, looking for the residual point of the Torque / Angle trace.
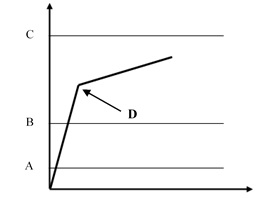
A | Cycle start | B | Minimum torque |
C | Maximum torque | D | Breakaway = Residual |
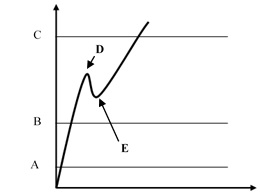
A | Cycle start | B | Minimum torque |
C | Maximum torque | D | Breakaway |
E | Residual |
Define the torque limits such that the residual point is OK in the result.
The Final angle monitoring torque, which must be greater than the Cycle start, defines the point from which the device algorithm starts analyzing the torque/angle trace. This is useful to filter all the noise that may occur at low torque value, and that could be detected as a false residual point.
Torque result:
If the residual point is detected, the result is associated with the residual point; the test is OK if the residual falls within the limits.
If the residual is not detected or the torque goes over the maximum torque, the torque result is the maximum value. Therefore, if the maximum value falls within the limits, the torque result is still OK, but the overall result is marked as Not OK.
If the torque goes over the Change Screw value, the residual is no longer detected and the torque result is the maximum torque.
In the configuration of the residual torque/angle strategy, there are two advanced parameters:
Breakaway angle threshold: it specifies the maximum angle for the residual torque (measured from the Final angle monitoring torque).
Residual angle threshold: it specifies the maximum angle (measured from the Final angle monitoring torque) for the residual torque when a the residual torque is lower than the breakaway point.
If the residual point precedes the Residual angle threshold, the residual torque is detected. this is the normal condition for a residual torque test.
If the residual point is over the Residual angle threshold, the breakaway point is the result of the test. In this case, the Residual angle threshold should be increased to detect the proper residual point.
If the breakaway point is over the Breakaway angle threshold, the residual point is not detected even if the residual point precedes the Residual angle threshold
Residual Torque/Peak
This strategy evaluates the residual torque on a joint as the peak torque necessary to rotate the screw further.
With this strategy, the breakaway point is not detected automatically. Therefore, this is a less objective method of evaluating residual torque. It may be used when the residual torque/time or torque/angle methods cannot be performed.
A | Minimum torque | B | Maximum torque |
C | Torque peak |
Specify the torque limits in order to get a result “OK”.
If the Target Angle is not specified, the angle result is marked as Not Applicable.
If a Target Angle value is specified, the residual torque result is measured at the specified angle (starting from the Final angle monitoring torque) instead of the peak torque:
A | Minimum torque | B | Maximum torque |
C | Target angle |
Loose and tightening
The Loose and Tightening strategy is available only with STa 6000.
The purpose of this strategy is to evaluate the residual torque on a joint by loosening the bolt up to the target angle and by tightening it back to its original position.
The strategy is composed of two phases: in the first phase (loose), the operator unscrews the bolt for a few degrees; in the second phase (tightening), the operator screws the bolt until the original position is reached.
A | Torque | B | Angle |
C | Target angle | D | Original position target angle |
Specify the torque limits and set the Target angle to a few degrees, so that the torque during the loosening phase does not go under the Cycle start value.
The result of the test is OK when the bolt is tightened back to its position and within the specified torque limits.
Traceability tag
The traceability tag allows to link additional information to a test and they are collected by the operator.
There are several levels where the traceability tag can be required (route, subgroup, inspection, piece/part and sample), three sources from which the information are acquired (barcode, keyboard and picklist), and the possibility to enable the traceability tag request when a test not completed is resumed.
The Traceability tag of subgroup level are not supported in this version.
If the system is upgraded, the subgroup level traceability tag becomes route level traceability tag.
The traceability tag of piece/part level is available only for By part inspections.
In the following, some examples of possible use of the traceability tag.
Example 1
The traceability tag is configured in the following parameters:
Level: route.
Source: barcode.
Collection point: before.
Operations:
Configure a route with more than one inspection.
Start the route.
Select the inspection.
The barcode is required.
Scan of the barcode.
Complete the route.
If the route is repeated without exit the route page, the barcode is not required a second time.
The barcode is required only at the beginning of the first inspection of the route.
Example 2
The traceability tag is configured in the following parameters:
Level: inspection.
Source: picklist.
Collection point: after.
Operations:
Configure a route with two inspections.
Start the route.
Select the inspection.
Do the test.
After the first result of the inspection, select a tag from the picklist.
Complete the inspection.
Select another inspection.
Do the test.
After the first result of the inspection, select a tag from the picklist.
Complete the inspection.
Example 3
The traceability tag is configured in the following parameters:
Level: part (piece).
Source: barcode.
Collection point: before.
Operations:
Start the route.
Select the enabled inspection.
Before the first result, the barcode is required.
Scan the barcode, so that the first part (piece) is linked to the tag.
The first test point of all the other inspections are done without tag request.
Before the second result of the first inspection is done, the barcode is required.
Scan the barcode.
The second test point of all the other inspections are done without tag request.
This process is repeated for a number of times equal to the number of part (piece to test).
Example 4
The traceability tag is configured in the following parameters:
Level: sample.
Source: keyboard.
Collection point: after.
Operations:
Start the route.
Select an inspection.
At the end of each result, the input from the keyboard is required.
Inspection supported by devices
JSB | STa 6000 | STbench | STpad | STpalm | QA Station MT | Open Protocol | |
|---|---|---|---|---|---|---|---|
Cm/Cmk | YES | YES | YES | YES | YES | YES | YES |
SPC (tool) | YES | YES | YES | YES | YES | NO | NO |
ISO 5393 | YES | YES | YES | YES | NO | NO | NO |
ISO 6789:2003 | YES | YES | YES | YES | NO | NO | NO |
ISO 6789:2017 | NO | NO | YES | YES | NO | NO | NO |
Tool calibration | YES | YES | YES | YES | NO | NO | NO |
VDI/VDE 2645-2 | NO | YES | YES | YES | NO | NO | NO |
JJF 1610:2017 | NO | NO | YES | YES | NO | NO | NO |
Cp/Cpk | NO | YES | YES | YES | YES | NO | NO |
SPC (joint) | NO | YES | YES | YES | YES | NO | NO |
Binary | NO | NO | YES | YES | YES | NO | NO |
Attribute | NO | NO | YES | YES | YES | NO | NO |
Cp/Cpk (dimensional) | NO | NO | YES | YES | YES | NO | NO |
SPC (dimensional) | NO | NO | YES | YES | YES | NO | NO |
By part | NO | NO | YES | YES | YES | NO | NO |
Instruction | NO | NO | YES | YES | YES | NO | NO |
Picture | NO | NO | YES | YES | YES | NO | NO |
Transducers acquired from device
JSB | STa 6000 | STbench (or STpad on STbench) | STpad | STpalm | QA Station MT | Open Protocol | |
|---|---|---|---|---|---|---|---|
IRTT | NO | YES | YES (cable) | NO | NO | NO | NO |
SRTT | YES | YES | YES | NO | NO | YES | NO |
QRTT | NO | YES | YES (cable) | NO | NO | NO | NO |
Brake | YES | NO | YES | NO | NO | NO | NO |
Motorized Cell | NO | NO | YES | NO | NO | NO | NO |
Generic | NO | NO | YES (cable) | NO | NO | NO | NO |
Measuring devices acquired from device
JSB | STa 6000 | STbench | STpad | STpalm | |
|---|---|---|---|---|---|
STbench | NO | NO | - | YES | NO |
IRC-Connect | NO | NO | YES | YES | YES |
STwrench | NO | NO | YES | YES | YES |
STRwrench | NO | NO | YES | YES | YES |
STpad cable adapter | NO | NO | NO | YES | NO |
Inspection result reports
Below is a list of all the inspection result reports available:
Cm/Cmk
SPC (tool)
ISO 6789:2003
ISO 5393
Tool calibration
VDI/VDE 2645-2
ISO 6789:2017
JJF 1610:2017
Cp/Cpk (joint)
SPC (joint)
Cp/Cpk (dimensional)
SPC (dimensional)
Requirements for raw traces files
The files imported as raw traces must meet the following requirements:
The file formats supported are *.qap and *.txt.
The file must contain at least 10 lines.
The file must contain the following three columns: time (ms), torque (Nm), angle (°).
The separator of decimal places must be a comma or a period.
The separator of thousands is not allowed.
Each line of the file must contain at least 3 numerical values.
Values must be separated by a semicolon or a tab.
The maximum number of lines in a file is 50000.
The file must be UTF8 or ASCII and must not start with the Byte Order Mark (BOM).
Possible blank lines are ignored.
Below an example of the content of a file:
0;2.505;0.35
200;4.519;10.35
400;5.534;20.70
600;6.546;30.70
800;7.055;40.05
1000;7.363;50.05
1200;7.457;60.40
1400;7.483;70.40
1600;7.096;80.75
1800;2.608;90.75
ToolsNet 8 features
Data Communication Service | Notification Service | MQTT Server | |
|---|---|---|---|
Joint report | YES | NO | NO |
Scheduling by SPC failure | YES | YES | YES |
Scheduling by tool usage | YES | YES | YES |
Trace simulation | YES | NO | NO |
Inspection Production Based | YES | NO | OPTIONAL |
Tool Import | YES | NO | OPTIONAL |
Tool Model Import | YES | NO | OPTIONAL |
Barcode regex
The barcode regex feature enables the user to define Inspection and Route barcode identifiers that can match multiple non-identical barcode strings.
Regular expressions (regex) are characters sequences that specify match patterns in strings. By using a regex as Inspection/Route barcode identifier, the user defines the characteristics a barcode string must have in order to match the Inspection/Route identifier.
In this way, a barcode scan can trigger a match between the barcode string and the Route/Inspection identifier even if the two strings are non-identical, making possible to link the same Inspection/Route to a group of barcode strings that share the specified characteristics.
The barcode regex identifiers must use regex syntax compatible with Java 8. For more information, refer to Validating a barcode regex identifier.
The following table shows some examples of basic string characteristics and the regex constructs to use in order to match them:
The string must include | Regex |
|---|---|
A single digit | [0-9] |
A single letter | [A-z] |
A single uppercase letter | [A-Z] |
A single lowercase letter | [a-z] |
Two letters | [A-z]{2} |
A single digit between 3-6 | [3-6] |
A single letter between C-M | [C-M] |
Any value (zero or multiple times) | .* |
Any value (three times) | .3 |
A whitespace | \s |
Text containing A or B | (A|B) |
Text containing A and B | (?=.*(A))(?=.*(B)) |
Text starting with ABC | ^ABC |
Text ending with ABC | ABC$ |
The following table shows some scenario examples and their matching regex constructs:
# | Scenario | Regex |
|---|---|---|
1 | In position 1-2-3 there are digits | ^[0-9]{3} |
2 | In position 4-5-6 there are letters | ^.{3}[A-z]{3} |
3 | Exact value of position 7-8 is ER | ^.{6}(ER) |
4 | In position 9-10 there is a number between 10 and 49 | ^.{8}[1-4][0-9] |
5 | In position 9-10 there is a number between 10 and 50 | ^.{8}([1-4][0-9]|50) |
6 | In position 9-10 there are letters between CA and LZ | ^.{8}[C-L][A-Z] |
7 | The text contains XYZ | XYZ |
8 | The text contains 12 and AB independently from the order | (?=.*(12))(?=.*(AB)) |
9 | Scenarios #1 #2 #3 #4 at same time | ^[0-9]{3}[A-z]{3}(ER)[1-4][0-9] |
10 | Scenarios #1 #2 #3 #4 #7 at same time | (?=.*([0-9]{3}[A-z]{3}(ER)[1-4][0-9]))(?=.*(XYZ)) |
11 | Scenarios #1 #3 #6 at same time | ^[0-9]{3}.{3}(ER)[C-L][A-Z] |
12 | In position 1-2-3 there are letters, followed by a dot, then a letter, a whitespace and ends with a number | ^[A-z]{3}[.][A-z]\s.*[0-9]$ |
Validating a barcode regex identifier
For illustrative purposes, the following procedures use two of the several regex validators available online. It is possible to use different regex validators, but make sure to always use one that supports regex in Java 8.
To validate your barcode regex identifier, do the following:
Go to https://regex101.com/.
In the left panel, under the category Flavor select Java 8.
On the top of the page, type or paste your barcode identifier in the field Regular Expression.
The syntax of your barcode identifier is automatically highlighted with different colors matching the constructs' different meanings.
In the right panel, expand the Explanation category to view a detailed explanation of which type of data each regex construct matches.Expand the Quick reference category to view a glossary of basic regex construct.
To get a visual representation of your barcode regex identifier, do the following:
Go to https://regexper.com/.
In the text field, type or paste your barcode regex identifier.
Click Display.
Glossary
Parameter | Definition |
|---|---|
Angle correction | When the joint design or space limitations preclude use of standard sockets or tools, it may be necessary to use special extension spanners to fit the application. When an extension is used, the angle correction constant permits linear compensation of extension torsion due to the torque applied. It is a fixed additive value. The value is expressed in degrees at the reference torque (Torque nominal). |
Batch size | This parameter specifies how many times the test must be executed. Inside an inspection, this is the number of results expected to complete the inspection. |
Breakaway threshold | It specifies the maximum angle for the residual torque (measured from the Start Final Angle). Over this angle the test result is marked as “not detected”. |
Change screw at | Over-torque threshold that generates an alarm during the test if passed. The alarm notify to the operator that the over-torque applied has damaged the screw. The screw replacement is recommended. This must be higher than the Final Torque max value. |
Cm index | The Cm index describes machine capability; it is the number of times the spread of the machine fits into the tolerance width. The higher the value of Cm, the better the machine. |
Cmk index | The Cmk index describes the capability corrected for position. It is not much use having a high Cm index if the machine setting is way off center in relation to the middle of the tolerance range. A high Cmk index means, then, that you have a good machine with a small spread in relation to the tolerance width, and also that it is well centered within that width. If Cmk is equal to Cm, the machine is set to produce exactly in the middle of the tolerance range. |
Cp index | The Cp index describes process capability; it is the number of times the spread of the process fits into the tolerance width. The higher the value of Cp, the better the process. |
Cpk index | The Cpk index describes the process capability corrected for position. It is not much use having a high Cp index if the process setting is way off center in relation to the middle of the tolerance range. A high Cpk index means, then, that you have a good process with a small spread in relation to the tolerance width, and also that it is well centered within that width. If Cpk is equal to Cp, the process is set to produce exactly in the middle of the tolerance range. |
Cycle complete | When the torque goes and remains under this value for longer than the End cycle time parameter, the test ends (click wrench). |
Cycle start | Torque value from which to start the torque measurement. This must be higher than the transducer Minimum Load value. |
End cycle time | This timeout defines the end of the test. |
Filter frequency | Filtering is a digital operation done on the torque values in order to reject measurement noise and to improve the quality of the measurement results. The filter frequency is a value that gives an indication of what the data collector “ignores” from the process it is monitoring. This value should be chosen carefully: a value that is too small (for example 10 Hz) produces a not correct result for the fast tests made on power Tools. On the other hand, a value that is too large (1000 Hz) can be responsible for noisy traces and results. |
Final angle monitoring torque | For control strategies involving angle measurement, it specifies the torque value from which the angle measurement starts. |
Free round | Free rounds before starting the braking; used for some screwdrivers requiring a number of free rounds to reach the proper operating speed before starting the test operation. |
Friction coefficient | Dimensionless scalar value which describes the ratio of the friction force between two bodies and the force pressing them together. The coefficient of friction depends on the materials used. |
Measure delay time | This timeout is used to filter the possible spikes or noise at the beginning of the test. When the torque reaches the Cycle Start value, the timer starts. During this interval the torque is not considered. |
Measure torque at | Point at which the torque value is measured. The two options are: torque peak or angle peak. It defines which value to acquire on the curve as torque result, if on the local max torque or angle at the end of the curve. |
Minimum pulse | Minimum pulse to calculate the Cm-Cmk related to the number of pulses per second. |
Maximum pulse | Maximum pulse to calculate the Cm-Cmk related to the number of pulses per second. |
Ratchet time | Applied instead of the End cycle time when the torque goes below the cycle start but has not yet reached the Minimum torque value. This allows the operator to release the torque for a while and recharge during the test operation. |
Relaxation time | Due to the mechanical relaxation of the wrench, the torque peak detected by the wrench slightly decreases after a short time interval. This parameter allows to adjust the peak detection in case of wrenches that do not save the torque peak, thus reducing discrepancies between the transducer and the wrench torque peak detections. |
Reset time | This timeout is used to filter the possible spikes/bounces after the click-point. When the torque goes below the cycle complete value, the timer starts. During this time the torque trace is not analyzed (any click-point possibly occurring during the reset time is not considered). |
Residual angle threshold | It specifies the maximum angle (measured from the Start Final Angle) for the residual torque when a the residual torque is lower than the breakaway point. |
Slip torque | The slip torque gives the requested drop in torque after the click-point. If the torque drops more than the slip torque, the peak value is considered as click-point; if not, the peak value is ignored. |
Subgroup size | This parameter defines the number of tests (subgroup) necessary to define each point (the average value of the tests in the subgroup) of the SPC charts. |
Subgroup frequency | SPC, the points shown on the X-R chart are the averages of the set of tests defined in the Subgroup size parameter. The Subgroup Frequency parameter defines the frequency of the points considered in the chart and in the SPC rules:
|
Torque correction coefficient | When the joint design or space limitations preclude use of standard sockets or tools, it may be necessary to use special extension spanners to fit the application. In these cases, the wrench measure must be adequately compensated because the factory calibration is made for the standard arm and the extension arm increases the measured torque. The angle measure is also affected by the extensions, due to its specific torsion when the torque is applied. |
Torque threshold | Limit of the torque value. |
Yield point | Increasing a torque on a joint, this is the point at which the elastic behavior ends and the plastic elongation begins. |
Yield stress point | Theoretical point of stress (pressure) beyond which the material loses its elasticity and becomes permanently stretched. |
Reference documents
ISO 6789 - ISO 6789:2003 - Third edition 2003-04-01
ISO 6789 - ISO 6789-2:2017 - First edition 2017-02
ISO 5393 - ISO 5393:1994 - Second edition 1994-05-01
CNOMO - CNOMO E41.32.110N – CNOMO - July 1990
VDI/VDE 2645-2 - VDI/VDE 2645-2 - September 2014
JJF 1610-2017 - JJF 1610-2017 - May 2017