Gage R&R
On the left side of the menu bar, click Analysis > Gage R&R.
The methodology of Gage R&R (which stands for repeatability and reproducibility) is a statistical analysis used to measure the amount of variation due to the measurement system and the operators.
The Gage R&R allows to reduce the errors and to improve the quality of data by:
determining where the variation in the measurement takes place.
understanding the source of the variation.
predicting the percentage or probability of measurement error.
The Gage R&R analysis done in QA Supervisor is Crossed type. The statistical analysis is conducted to define the effectiveness of a measurement system. It can be used when more than one operator runs multiple times the test on the same part, and the object does not undergo variations during the measurements. In this case, multiple objects are measured multiple times by multiple operators randomly:
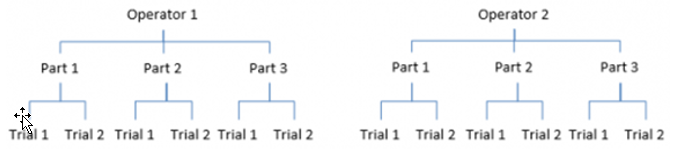
The most common statistical method employed to run this analysis is the 2-way anova test (Anova ANalysis Of VAriances).
Using QA Supervisor Crossed Gage R&R study, it is possible to assess the variation in the measurement system when at least two operators have run the same inspection at least two times.
Below an example of a Gage R&R Crossed analysis:
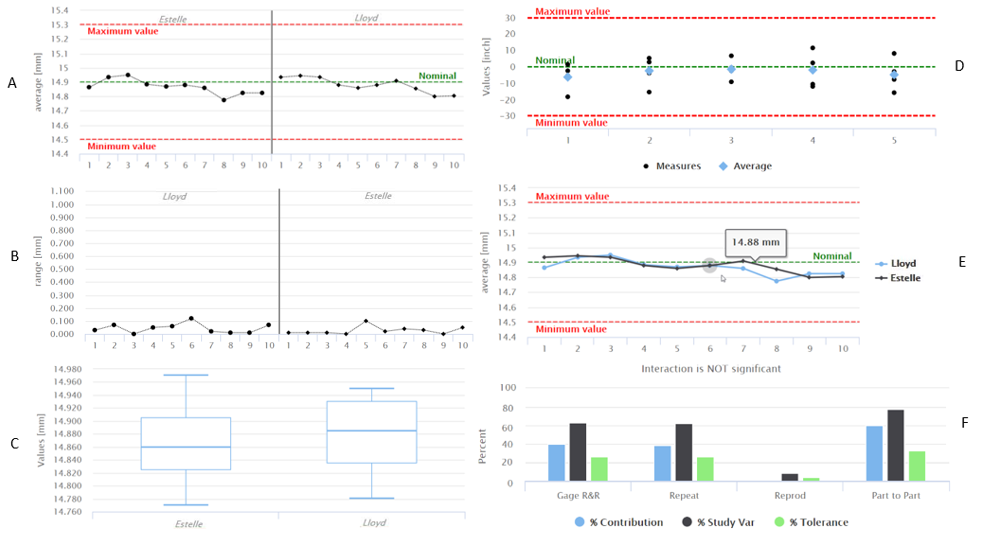
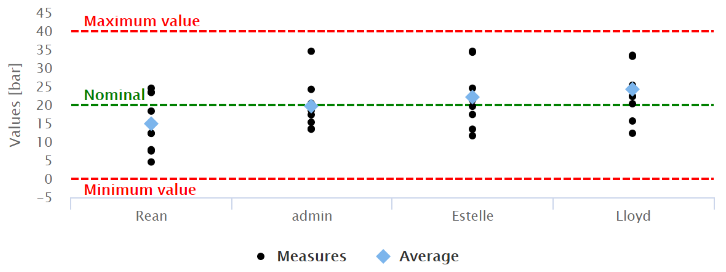
A - For each operator, the average values of the measurements done on a single part:
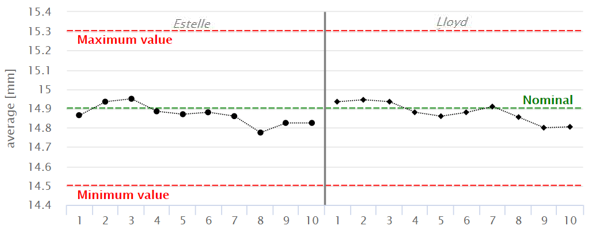
When the points fall within control limits, the operators measurements are consistent.
B - For each operator, the range of the measurements done on a single part:
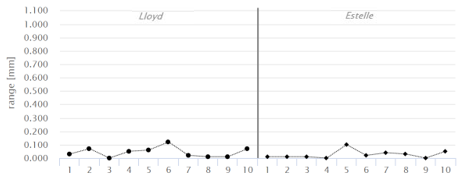
The smaller the range, the lower the variation of the measurement system.
C - For each operator, the distribution of the measurements done:
if the measurements done by each operator are less than 10, the individual value chart is generated:
if the measurements done by each operator are more than 10, the boxplot is generated:
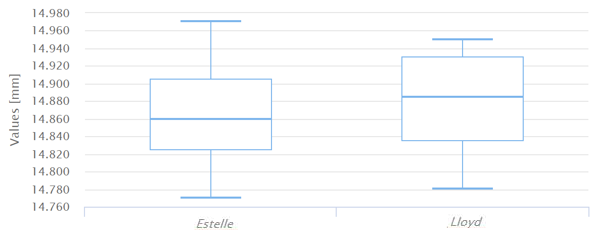
The amount of variation of the measurements for each operator should be equal.
D - For each part, the distribution of the measurements collected:
if the measurements on a single part are less than 9, the individual value chart is generated:
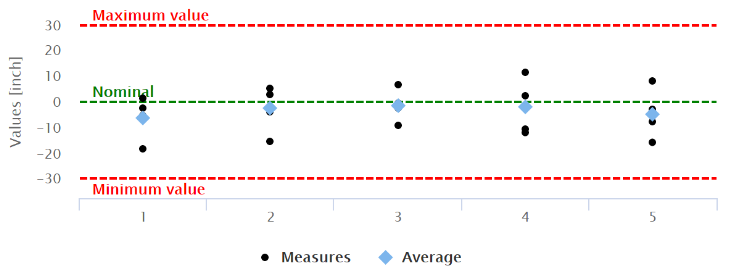
if the measurements on a single part are 9 or more, the boxplot is generated:
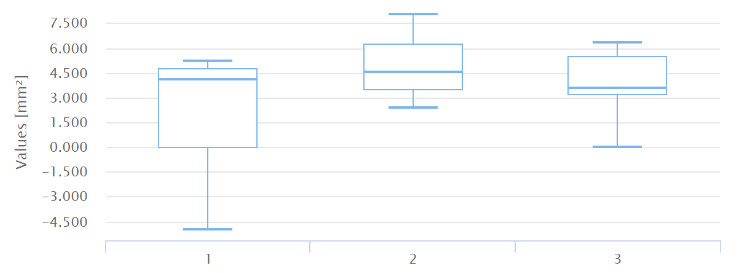
The measurement system has low variation when multiple measurements on same part have a minimal variation.
E - The differences between the averages of the measurements done on a single part by each operator:
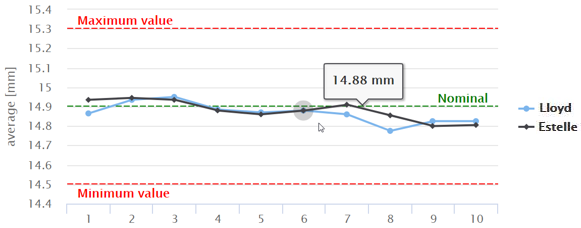
When lines coincide, the operators take similar measurements; when lines cross or are not parallel, the operator consistency depends on the part measured; when a line is higher or lower than the others, the operator affects the measurement by measuring consistently high or low.
F - The result of 2-way anova test (Anova ANalysis Of VAriances):
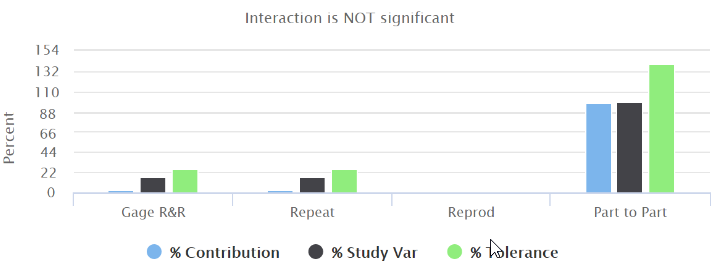
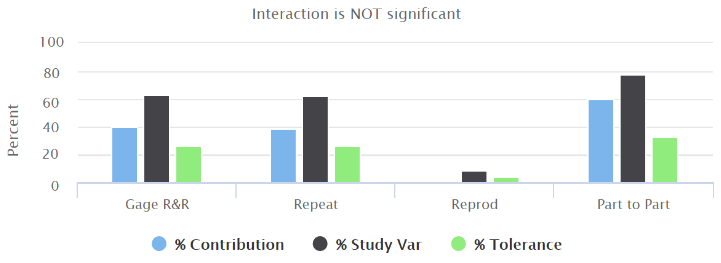
Gage R&R: shows that the variation is due to the different operators performing the test.
Repeatability (meaning the contribution of the measurement system - this component does not depend on the operators): shows that the variation is due to the same operator that measures the same part multiple times.
Reproducibility (meaning the contribution of the operators and the environmental conditions of the measurements): shows that the variation is due to the different operators that measure the same part.
Part to Part: shows that the variation is due to the different parts under test.
In an acceptable measurement system:
the largest %Contribution to the variability must be due to the Part to Part component.
If the repeatability %Contribution is high, you need to investigate the equipment used to perform for the test.
If the reproducibility %Contribution is high, you need to investigate how the operators perform the test.
As defined by the AIAG guidelines, the measurement system variability must be less than 10% of the total process variation.
If you want to assess process enhancement, %Study Var is a better approximation of measurement precision.
If you want to assess the capability of the parts compared to specification, %Tolerance is the proper estimation.


