STpad (07.04x)
Data collector
General Data Protection Regulation (GDPR)
This product offers the possibility to process personal identifiable information such as system user name, role and IP-address. The purpose of this processing capability could be to enhance quality control through traceability and proper access management.
If you decide to process personal data you need to be aware of and comply with relevant personal data protection rules, including, in the EU the GDPR as well as other applicable laws, directives and regulations. Atlas Copco can in no way be held liable for any use made by you of the product.
Security Windows machine
Keep the operating system up to date with security patches. The device is a Windows Machine: we recommend to install the correct antimalware depending on the customer policy.
Introduction
General Information
The STpad is a rugged device equipped with 802.11, Bluetooth and GNSS for wireless data communications. The STpad is a rugged 10.1” tablet computer capable of 1920 x 1200 resolution. The STpad is delivered with Windows 10 Enterprise version in a kiosk mode so that only Atlas Copco applications can be used
About Configuration Manual
The Configuration Manual contains information on how to set up and configure the device. This manual is not intended to replace the training and expertise of the end-user.
Before beginning the installation or configuration process make sure to inspect all components and accessories. Contact Atlas Copco Customer Center if there are any missing or damaged items.
Revision history
Software version | Change |
|---|---|
07.04x | Tools parameters updated (for more information, see "STbench with PC Configuration Manual / STpad Configuration Manual"). |
07.03x |
|
07.02x |
|
07.01x |
|
07.00x |
|
06.03x |
|
06.02x |
|
06.01x |
|
06.00x |
|
04.05x |
|
04.04x |
|
04.03x |
|
04.02x |
|
04.01x |
|
04.00x |
|
03.01x |
|
03.00x |
|
02.00x |
|
01.03x |
|
01.02x |
|
01.01x |
|
Configuration overview
General Information
The STpad is a portable and rugged tool designed to streamline the following operation:
Tool check: The STpad offers a set of tests for evaluating click-wrenches, power tools and pulse tools, measuring torque/angle values and producing results with statistical parameters. This enhances the quality of the tightening operations on a production line. The test results can be retrieved by the STpad management software (QA Inspector) and exported into an Excel file.
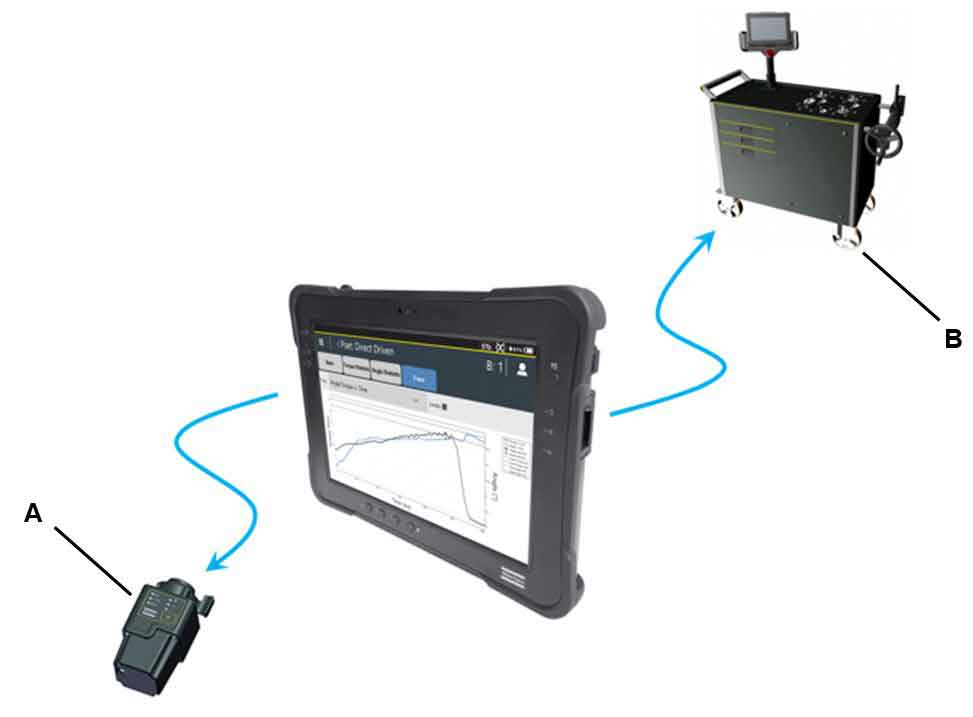
A | IRC-Connect | B | STbench |
Getting started
Prerequisites
Anyone interested in learning more can benefit from reading this manual and other STpad documentation.
For a complete understanding of the technical aspects in the guide we recommend the following:
knowledge of the main concepts of the STa 6000 / STa 6000 Plus.
Before starting the application make sure that:
the STpad battery is charged.
Starting
After switching on the device, the following is displayed:
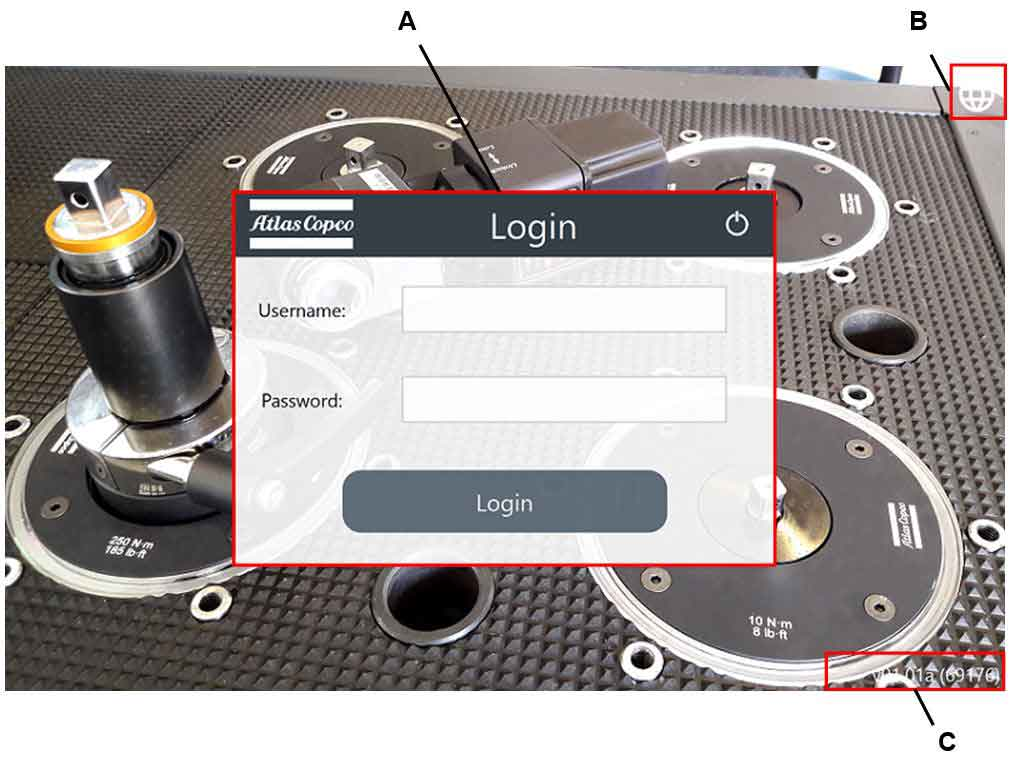
A | Login Dialog box | B | Language icon |
C | Reference Firmware version |
At the first login, type the default login information:
Username: admin
Password: admin
Selecting the language
Tap Language icon. The following options are available:
German.
English.
French.
Italian.
Swedish.
Czech.
Spanish.
Hungarian.
Chinese.
Japanese.
Polish.
Portuguese.
Rumanian.
Slovak.
Tap the necessary language.
Starting the device
In the Username box, type the username.
In the Password box, type the password.
Tap Login.
If the device software version is different from the STbench firmware version, a warning message suggesting to install a new version is displayed.
Shutting down the STpad
Tap the power off icon on the upper-right corner of the Login dialog box.
In the lower- right corner of the "Exit STpad" window, tap OK.
Features
Home
After starting STpad, the following Home page is displayed:
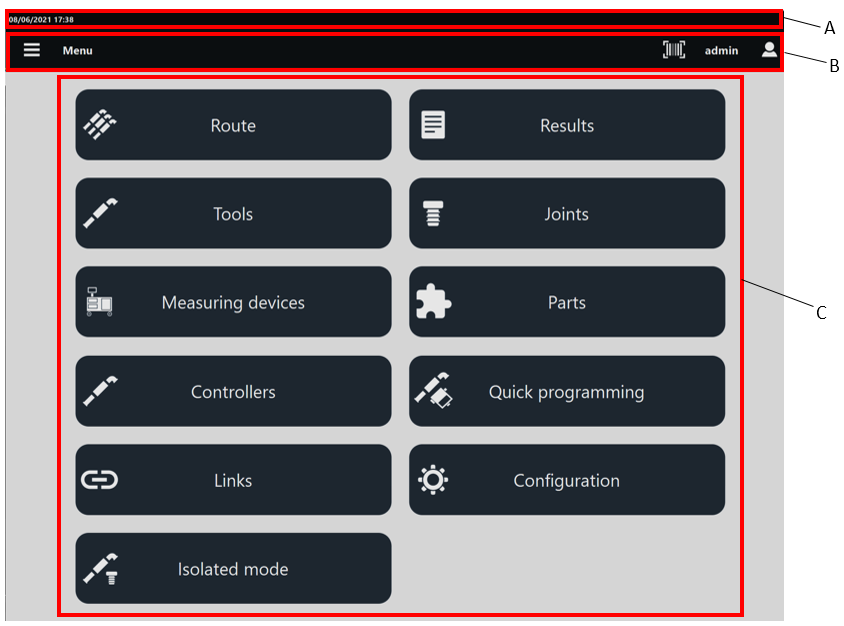
A | Header | B | Toolbar |
C | Available features |
The header provides the following information:
Date and time (
 ): it is associated to the date and time of the operating system.
STbench connection icon (
 ): it is displayed only when the STpad is connected to the STbench.
IRC-Connect connection icon (
 ): it is displayed only when the STpad is connected to the IRC-Connect.
STwrench connection icon (
 ): it is displayed when the STpad is connected to the STwrench.
Battery charge level icon (
 ): it shows the battery charge level of the STpad.
The battery charge level icon includes both a battery icon (filled according to the battery level) and a percentage value (that refers to the battery level in real time).
The toolbar provides the following functionality:
Menu icon (
 ): it lists all of the available features of STpad. The menu icon is always available on the toolbar, regardless of the selected feature.
Barcode button (
 ): allows to scan a barcode to search the corresponding inspection(s) (Tool, Joint or Part inspections) on the measuring device. If the search finds a single inspection, it is automatically run; if the search finds multiple inspections with the same barcode identifier, run the inspection of interest from the list.
The barcode button is displayed only if enabled external software.User/Logout icon (
 ): tap it to select either the user to associate to STpad or to log out.
To logout from the STpad application: tap Logout, then in the User logout window, tap OK. After tapping OK, the main screen with the Login dialog box is displayed.
To get back to Home page, tap Cancel.
Below the Menu items are listed:
Home: it allows to get back to the Home page.
Route: it allows to open the Route page. It is also possible to open the Route page by tapping Route placed in the middle of the Home page (for more information, see Route).
Results: it allows to open the Results page. It is also possible to open the Results page by tapping Results placed in the middle of the Home page (for more information, see Results).
Tools: it allows to open the Tools page. It is also possible to open the Tools page by tapping Tools placed in the middle of the Home page (for more information, see Tools).
Joints: it allows to open the Joints page. It is also possible to open the Joints page by tapping Joints placed in the middle of the Home page (for more information, see Joints).
Measuring devices: it allows to open the Measuring devices page. It is also possible to open the Measuring devices page by tapping Measuring devices placed in the middle of the Home page (for more information, see Measuring devices).
Parts: it allows to open the Parts page. It is also possible to open the Parts page by tapping Parts placed in the middle of the Home page (for more information, see Parts).
Controllers: it allows to open the Controllers page. It is also possible to open the Controllers page by tapping Controllers placed in the middle of the Home page (for more information, see Controllers).
Quick programming: it allows to open the Quick programming page. It is also possible to open the Quick programming page by tapping Quick programming placed in the middle of the Home page (for more information, see Quick programming).
Links: it allows to open the Links page. It is also possible to open the Links page by tapping Links placed in the middle of the Home page (for more information, see Links).
Configuration: it allows to open the Configuration page. It is also possible to open the Configuration page by tapping Configuration placed in the middle of the Home page (for more information, see Configuration).
Isolated mode: it allows to open the Isolated mode page. It is also possible to open the Isolated mode page by tapping Isolated mode placed in the middle of the Home page (for more information, see Isolated mode).
Route
The route is a set of tests to run.
The device can store up to 100 routes into its own memory. Each route can include up to 500 Inspections.
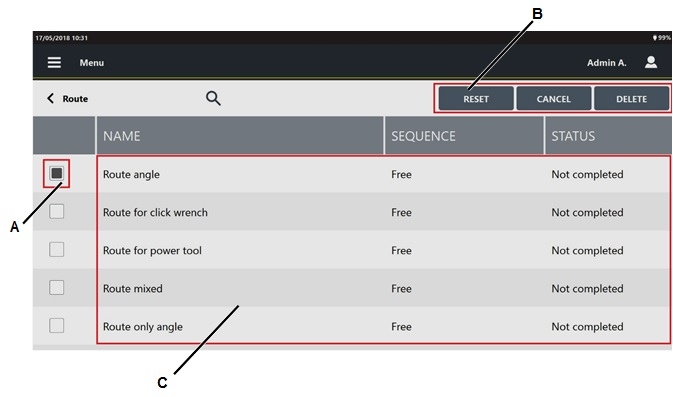
In the Home page, select Route. The following is displayed:

A | Search button | B | Command buttons |
C | Play button | D | List of Routes |
Below are the columns that define the list of Routes:
Name: it is assigned when the route is created. For more information about how to edit the Route name, see “Editing the Route name".
Sequence: it can be either "Free", "Forced by piece" or "Forced by inspection", depending on the way the inspections configured in the Route are run.
In a Free route, the inspections can be run in any order.
In a Forced by piece route, the order of the measurements is defined during the configuration of the route.
In a Forced by inspection route, the order of the inspections is defined during the configuration of the route.
Status: it can be either “Completed” or “Not completed” depending on the status of the route.
To sort the columns that define the list of Routes: tap the column to be sorted, the up arrow (placed on the right of the column heading) lists the Name (or Sequence / Status) details in ascending alphabetical order; the down arrow lists the Name (or Sequence / Status) details in descending alphabetical order.
SCAN: allows to scan a barcode to find the corresponding inspection(s) (Tool, Joint or Part inspections) remotely.
If the remote search finds a single inspection, a Route with the name of the barcode identifier is created and the inspection is automatically run.
If the remote search finds multiple inspections with the same barcode identifier, a Route with the name of the barcode identifier is created and the inspection of interest can be run from the list.
The measuring device stores only the latest Route created scanning a barcode identifier, the previous one is deleted from the device memory.
During the synchronization with an external software, a popup message informing of the ongoing synchronization might be displayed.
- Adding Route(s) through the Template file - General information
- Deleting a Route
- Resetting a Route
- Editing a Route
- Running a free Route
- Running a forced by piece Route
- Running a forced by inspection route
- Searching a Route
- Searching in a Route
- Filtering the routes using the custom fields
- Filtering the inspections in a route
Adding Route(s) through the Template file - General information
The Route page permits the user to see the route(s) previously imported on the device.
Make the route(s) only through the Template file for routes (for more information, see “Making route(s) from the own PC”). It is not possible to make a route directly from the device.
Adding Route(s) through the Template file
Generate the Template file for routes on a USB storage device (for more information, see Generating template for routes).
Put the USB storage device into the USB port of the own PC.
From the PC, open the USB storage device.
Open the file STpad_RouteImportFile.xlsm. The following is displayed:

Route Name: type the name of the route.
Type: select one of the available options: Tool, Joint, Part.
Tool ID / Joint name / Part name: type the Tool ID/name of the joint/name of the part in the same way as the ID/name specified for an existing tool/joint/part stored on the device (for more information, see “Tools/Joints/Part”). This box is case-sensitive.
Inspection Name: type the Inspection Name in the same way as the Inspection Name specified for an existing inspection. Pay attention: type only an inspection already linked to the tool/joint/part given in the previous Tool ID / Joint name / Part name box (for more information, see “Tools”). This box is case-sensitive.
Language: select the language from the related drop-down box.

Check the Excel option for the workbook calculation. Open a Excel file and click File > Options. On left side of the Excel options dialog box, select Formulas > Automatic option for the Calculation options section.
Complete the file STpad_RouteImportFile.xlsm to define the necessary route(s).
When all the fields are filled in, the Wrong field column becomes green.
Once the Wrong field column in correspondence of the new route(s) is green colored, click the blue button Sort and export to automatically generate the file STpad_RouteImportFile.stpad.
The file STpad_RouteImportFile.stpad is automatically saved into the USB storage device.
Only the file STpad_RouteImportFile.stpad can be correctly imported on the device (for more information, see Importing the route(s) on the device
Save and close the file STpad_RouteImportFile.xlsm.
Close and remove the USB storage device.
Connect the USB storage device to the device.
Import the route(s) saved in the file STpad_RouteImportFile.stpad on the device (for more information about how to import routes, see “Importing the route(s) on the device”).
Click the Menu icon > Route to check that the import of the route(s) is correctly done.
Deleting a Route
On the upper-right corner of the Route page, tap Select . The following is displayed:
A
Route check box
B
Command buttons
C
List of Routes
Select the check box(s) of the route(s) to delete.
On the right of the "Selecting a Route" Toolbar, tap Delete.
Resetting a Route
On the upper-right corner of the Route page, tap Select . The following is displayed:
A
Route check box
B
Command buttons
C
List of Routes
Select the check box(s) of the route(s) to reset.
On the right of the "Selecting a Route" Toolbar, tap Reset.
By resetting a route, the status of the route becomes "Not completed" and it is possible to run it again.
The results saved before the reset are not deleted.
All the traceability tag are reset.
Editing a Route
From the Route page, tap an existing route.
The following is displayed: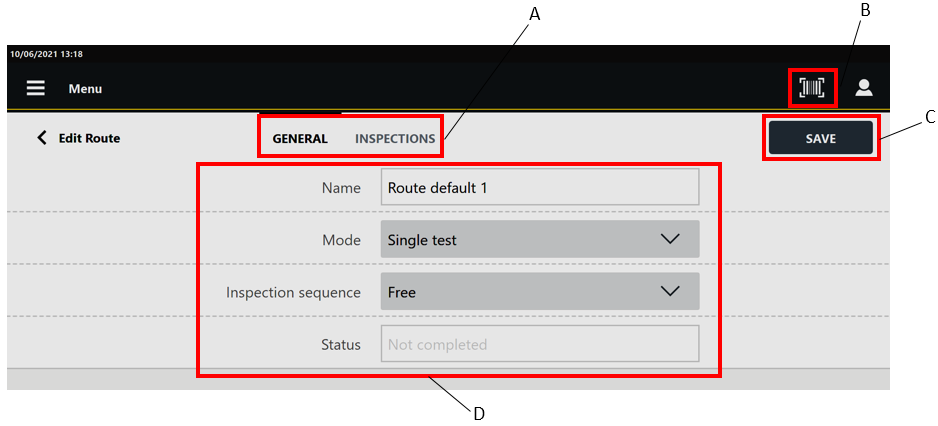
A
Categories
B
Barcode button
C
Save button
D
Parameters
In the Edit route page, edit the Route parameters according to customer needs.
In the General category are displayed the parameters of the route.
In the Inspections category, it is possible to delete the inspections linked to the route.In the upper-right corner of the Edit route page, tap Save.
When enabled by external software, the Barcode button () allows to scan a barcode to search the corresponding inspection(s) inside the Route. If the search finds a single inspection, it is automatically run; if the search finds multiple inspections with the same barcode identifier, run the inspection of interest from the list.
The Barcode button is available only for Free routes.
Running a free Route
Connect the device to the necessary measuring device (for more information, see “Measuring devices”).
Import the necessary route(s) with "Free" sequence on the device (for more information, see “Adding Route(s) through the Template file”).
Tap the route name or the Run icon to run the route.
In the Edit Route page, tap Inspections.
If necessary, in the Edit Route page - General category, edit the route parameters according to customer needs (for more information, see “Editing a Route”).
In the Inspection page, tap Play in correspondence of the inspection to be run (for more information, see “Inspections”).
Running a forced by piece Route
Connect the device to the necessary measuring device (for more information, see “Measuring devices”).
Import the necessary route(s) with "Forced by piece" sequence on the device (for more information, see “Adding Route(s) through the Template file”).
In the Route page, tap Play in correspondence of the enabled inspection.
Navigating a forced by piece Route
In the measurement screen of a forced by piece route, it is possible to navigate the inspections.
To switch to the previous or next inspections, tap on the Back arrow icon ( ) or the Next arrow icon (
 ).
).
To return to the current inspection run, tap on the Play button icon ( ).
).
To skip a measure (when enabled by external software):
select the Summary tab and tap on the Skip measure button.
from the Inspections tab of the Edit route page, tap on the Skip button.
If a measure of a forced by piece route is skipped, it is not possible to run it later.
Running a forced by inspection route
Connect the device to the necessary measuring device (for more information, see “Measuring devices”).
Import the necessary route(s) with "Forced by inspection" sequence on the device (for more information, see “Adding Route(s) through the Template file”).
In the Route page, tap Play in correspondence of the enabled inspection.
Navigating a forced by inspection route
In the measurement screen of a forced by inspection route, it is possible to navigate the inspections.
To switch to the previous or next inspections, tap on the Back arrow icon () or the Next arrow icon ().
To return to the current inspection run, tap on the Play button icon ().
To skip a measure (when enabled by external software):
select the Summary tab and tap on the Skip inspection button.
from the Inspections tab of the Edit route page, tap on the Skip button.
If an inspection of a forced by inspection route is skipped, it is not possible to run it later.
Searching a Route
In the Home page, tap Routes.
In the central part of the toolbar, tap the Search icon (
 ).
).In the Search text box, type the string to search.
Partial matching is supported: routes whose name, sequence or status match the text string are shown.
To delete the typed string, tap the Reset icon ( ).
).
To exit the search function, tap the Left arrow icon ( ).
).
Searching in a Route
In the Home page, tap Route between the available features.
In the Route page, select a Route.
In the central part of the toolbar of the Edit Route page, tap Inspections.
In the Inspections category, tap the Search icon (
).In the Search text box, type the string to search.
Partial matching is supported: inspections whose status, inspection name, type, location, tool ID, part/joint name, part/joint identifier or tool serial number match the text string are shown.
To delete the typed string, tap the Delete icon ().
To exit the search function, tap the Left arrow icon ().
Filtering the routes using the custom fields
The list of routes can be filtered using the custom fields only if the enabled by external software.
In the Home page, tap Route.
In the upper right corner of the Route page, tap on the Filter button.
In the Custom filter dialog box, select the values to filter from the drop-down list of each object.
By selecting a value, the values displayed for the other objects change accordingly.
Tap on OK to apply the selected filters.
Filtering the inspections in a route
From the Route page, tap on an existing route.
In the upper right corner of the Inspections category, tap on the Filter button.
In the Inspection filter dialog-box, select/unselect the following Inspection status check boxes:
To do: select the checkbox to display all the inspections of the route marked with thestatus To do .
Partial: select the checkbox to display all the inspections of the route marked with the status Partial.
Completed: select the checkbox to display all the inspections of the route marked with the status Completed.
By default, all the Inspection status are selected.
Tap on the Update button to apply the Inspection filter.
By exiting the Edit route page, the Inspection filter is restored to the default.
Results
The Results section lists the results of the inspections done. By default, the results list is organized by date: the last inspection done is the first item of the list.
The device saves up to 50000 single results. If this amount is exceeded, the oldest results are overwritten by the new ones.
In the Home page, tap Results. The following is displayed:
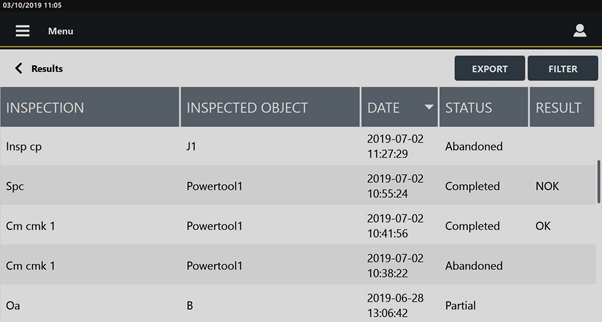
Below are the columns that define the list of results:
Inspection: it is assigned when the inspection is created. For more information, see “Inspections”.
Inspected object: name of the inspected object.
Date: execution date of the inspection. The date format is as follows: yyyy-mm-dd / hh:mm:ss.
Status: status of the inspection. Each inspection has one of the following status:
Partial: in case the number of samples is not completed or equal to 0.
Completed: in case the number of samples is completed.
Abandoned: in case the inspection/tool/joint is deleted or if the parameters that reset the statistics, change.
Result: result of the inspection (OK or NOK).
The inspection ISO 5393 does not give any result. The inspection SPC does not give any result if the ongoing subgroup is not completed.
It is possible to sort the columns that define the list of results either in ascending or descending alphabetical order, according to customer needs. Tap the column to be sorted (for example, Inspection column): the up arrow (placed on the right of the column heading) lists the inspection(s) (or Inspected Object / Status / Result) details in ascending alphabetical order; The down arrow lists the inspection(s) (or Inspected Object / Status / Result) details in descending alphabetical order.
In the Date column, the up arrow lists the inspections from the oldest one to the latest one; The down arrow lists the inspections from the latest one to the oldest one.
It is possible to customize the sequence of the columns that defines the list of results, according to the customer needs. Tap the column heading to be moved (i.e. Inspected Object / Inspection / Date / Status / Result) and drag and drop it in the necessary position.
Exporting the results
On the upper-right corner of the Results page, tap on the Export button to export all the Inspections results displayed in the Results page.
If a filter is applied in the Results page, only the inspections results filtered are exported.
Filtering the results
On the upper-right corner of the Results page, tap on the Filter button.
In the Result filter dialog box, select the check box(es) to enable:
Start date
End date
Number of result
Set the values of the selected filters.
On the lower-right corner of the Result filter dialog box, tap on the Update button to apply the selected filters.
Searching a result
In the Home page, tap Results.
In the central part of the toolbar, tap the Search icon (
).In the Search text box, type the string to search.
Partial matching is supported: results whose inspection name, inspected object, date, status, result, part/joint identifier or tool serial number match the text string are shown.
To reset the typed string, tap the Reset icon ().
To exit the search function, tap the Left arrow icon ().
Viewing the details of the inspection result
In the Results page, click the inspection to view. The Result details page opens:
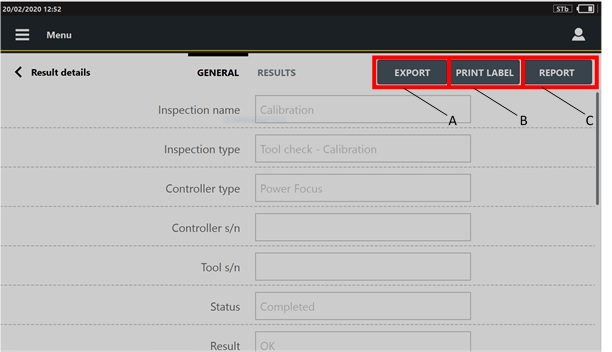
A | Export button | B | Print label button |
C | Report button |
On the upper-right corner of the Results details page, the Export button allows to export the result details of the selected inspection on an external device.
In the Result details page of Visual check - Instructions and Visual check - Picture inspections, the Export button is not displayed.
On the upper-right corner of the Result details page, the Print label button is displayed for the completed Cm/Cmk ISO, SPC tool check, CAM/Cpk CNOMO, ISO 6789:2003 inspections, and tool calibrations.
On the upper-right corner of the Result details page, the Report button is displayed for the completed Cm/Cmk ISO, CAM/Cpk CNOMO and tool calibrations.
The General category is a read-only page that lists the parameters of the selected inspection. The parameters change depending on the inspection selected in the Results page.
The Results category lists the single results done during the inspection. The first column of the Result details page displays the index of the results. If a result is NOK, the related value is highlighted with a red colored bar.
If during the test run a measurement is deleted or is not detected, it is deleted from the Measure page, but it is displayed in the Results category.
Not detected measurements are marked with a dash.
Deleted measurements are grayed out.
Measurements not detected and deleted are marked with a dash and are grayed out.
Tap a single value to open the Measure page, where the general information of the test are displayed.
In the Trace category, the acquired trace is shown.
If the trace has not been acquired, the Trace category is not displayed.
In the Photo category the photo saved during test run are shown.
In the Traceability tag category, the used traceability tags, assignable causes, corrective actions and comments added during the test run are shown.
Tools
Tools section describes how to setup the parameters (Tools and Inspections) necessary to do a test.
The device can store up to 10000 tools into its own memory.
In the Home page, select Tools. The following is displayed:
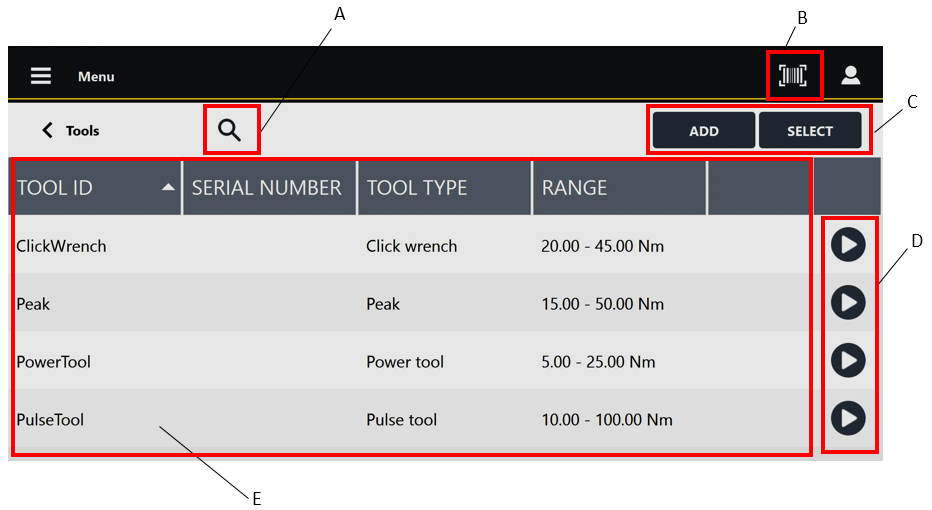
A | Search button | B | Barcode button |
C | Command buttons | D | Play buttons |
E | List of Tools |
Below are the columns that define the list of Tools:
Tool ID: ID assigned when the Tool is created.
Serial Number: serial number assigned when the Tool is created.
Tool Type: type assigned when the Tool is created.
Range: torque operating range assigned when the Tool is created.
To sort the columns that define the list of Tools: tap the column to be sorted, the up arrow (placed on the right of the column heading) lists the Tool ID (or Serial Number / Tool type / Range) details in ascending alphabetical order; the down arrow lists the Tool ID (or Serial Number / Tool type / Range) details in descending alphabetical order.
To customize the sequence of the columns that defines the list of Tools: tap the column heading to be moved (Tool ID / Serial Number / Tool Type / Range), then drag and drop it to the necessary position.
When enabled by external software, the Barcode button () allows to scan a barcode to search the corresponding Tool inspection(s) on the measuring device. If the search finds a single Tool inspection, it is automatically run; if the search finds multiple Tool inspections with the same barcode identifier, run the inspection of interest from the list.
The Play button gets active only after adding/updating the inspection(s) linked to the Tool. If enabled, tap Play to run the test.
Adding a Tool
In the Home page, tap Tools.
On the upper-right corner of the Tools page, tap Add.

A
Categories
B
Save button
C
Parameters
In the General category of the Add tool page, configure the tool parameters.
In the upper part of the Add tool page, select another category and configure the available parameters.
On the upper-right corner of the Add tool page, tap Save.
Tool parameters
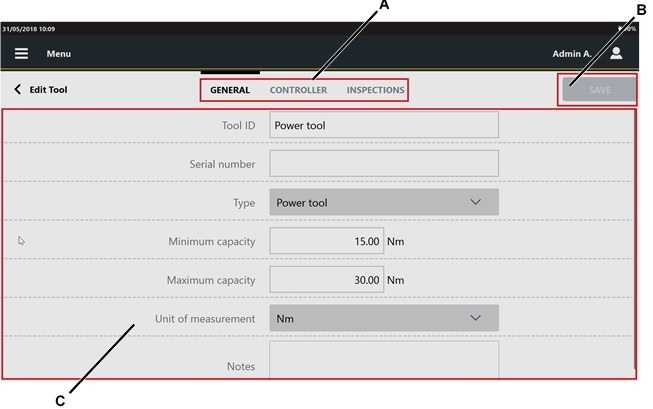
General category
Tool ID: type the Tool ID. The maximum number of characters permitted is equal to 50. Tool ID is a required field.
Serial number: type the Serial number of the tool. The maximum number of characters permitted is equal to 50.
Type: select the type of the tool. Select between the following:
Click wrench
Power tool
Peak
Pulse tool
Click type: from the drop-down menu, select between Click and Cam-over.
The Click type field is available only if the tool type is set to Click wrench.
Minimum capacity: type the minimum capacity of the tool.
Maximum capacity: type the maximum capacity of the tool.
Unit of measurement: select the unit of measurement to use.
Model name: type the name of the tool model.
Notes: type the optional tool notes. The maximum number of characters is equal to 2000.
ISO 6789 category
This category is shown only if the Type is set to Peak or to Click wrench.
Peak tools are defined as Type I - Indicating torque tools.
Click wrenches are defined as Type II - Setting torque tools.
ISO 6789 class: from the drop down list select the class of the tool. All the classes defined in the ISO 6789 are listed.
Resolution (r): type the resolution value.
The resolution field is available for all classes of ISO 6789 Type I, and for class A, D and G of ISO 6789 Type II.
Type or calculate the following values for clockwise and/or counterclockwise directions:
brep: type the variation value due to the reproducibility, or tap Play to calculate the value.
The brep field is available for classes A, D and G of ISO 6789 Type II.
bod: type the variation value due to the geometric effect of the output drive of the torque tool, or tap Play to start the test.
bint: type the variation value due to the interface between the output drive and the calibration system, or tap Play to calculate it.
bl: type the variation value due to the variation of the force loading point, or tap Play to calculate it.
If the Tool is linked to an inspection, the following parameters cannot be modified: Type, ISO 6789 class, Click type.
Controller category
This category is available only for Power tools and Pulse tools.
Controller: it is possible to:
select a controller: tap the Search icon (
 ) and then select an already configured controller in the Controller page.
add a new controller: tap the Search icon (
). On the upper-right corner of the Controller page, tap Add to configure a new controller.delete the link to the controller: tap the Delete icon (
 ).
).
By selecting an already existing Controller unit, the information on the connectivity are automatically populated and cannot be edited.
Type: from the drop-down list select among:
Power Focus
Power MACS
Other controller
Open protocol
None
Then, configure the following parameters:
Serial number: type the Serial number of the controller. The maximum number of characters is 50.
Device IP Address: type the IP address of the controller. This parameter is available for controller type Power Focus and Open Protocol.
Port number: type the port number of the controller. This parameter is available for controller type Power Focus and Open Protocol.
Baud rate: select the baud rate. This parameter is unavailable for controller type Power MACS.
Deleting a Tool
In the Home page, tap tools.
On the upper-right corner of the Tools page, tap Select.
On the left side of the Tools page, select the check box of the tool(s) to delete.
On the upper-right corner of the Tools page, tap Delete.
On the Confirmation required message, tap OK.
Editing a Tool
From the Tool page, tap an existing tool to modify. The following is display
A
Categories
B
Save button
C
Parameters
In the Edit tool page, edit the necessary parameter(s) according to customer needs.
In the Inspection category, it is possible to configure the inspection(s) to perform with the tool. For more information about how to update the Inspections category, see the paragraph Tool inspections.
On the upper-right corner of the Edit tool page, tap Save.
Searching a Tool
In the Home page, tap Tools.
In the central part of the toolbar, tap the Search icon (
).In the Search text box, type the string to search.
Partial matching is supported: tools whose name, serial number, model name, tool type or range match the text string are shown.
To delete the typed string, tap the Reset icon ().
To exit the search function, tap the Left arrow icon ().
Tool inspections
The Inspection category assigns the test type according to the tool previously specified.
The maximum number of Inspections per Tool is 60.
The device assigns the following inspections:
Cm/Cmk ISO: it makes a Cm/Cmk test through the ISO statistics to evaluate the tool capability.
SPC: it is a method of quality control in which statistical methods are used. It makes a series of tests to evaluate an average value to be compared with successive mean values on the X/R chart. By analyzing these points in sequence it is possible to monitor and control the process.
ISO 5393: it makes a test with the selected tool in compliance with the ISO 5393 standards. For more information, see “ISO 5393 International Standard – Second Edition 1994-05-01”.
ISO 6789:2003: it makes a test with the selected tool in compliance with the ISO 6789 standards. For more information, see “ISO 6789 International Standard – Third Edition 2003-04-01”.
ISO 6789-2:2017 : it makes a test with the selected tool in compliance with the ISO 6789:2017 standards. For more information, see “ISO 6789-2:2017 International Standard ”.
CAM/Cpk CNOMO: it makes a Cm/Cmk test through the CNOMO statistics to evaluate the tool capability. For more information, see “CNOMO International Standard (E41.32.110N) – Edition July 1990”.
Calibration: it makes a calibration test to evaluate the tool capability. The calibration test calibrates power tools and pulse tools.
VDI/VDE 2645-2: it makes a test with the selected tool in compliance with the VDI/VDE 2645-2 standards. For more information, see “VDI/VDE 2645-2 – September 2014”
JJF 1610-2017: it makes a test with the selected tool in compliance with the JJF 1610-2017 standards. For more information, see “JJF 1610-2017 - 2017-05-28”.
Below is a list that links each tool type with the related available inspections:
Click wrench: Cm/Cmk ISO, SPC, ISO 6789, ISO 6789-2:2017, and CAM/Cpk CNOMO.
Power tool: Cm/Cmk ISO, SPC, ISO 5393, CAM/Cpk CNOMO, Calibration, VDI/VDE 2645-2 (only for motorized tools, continuously rotating), JJF 1610-2017.
Peak: Cm/Cmk ISO, SPC, ISO 6789, ISO 6789-2:2017 and CAM/Cpk CNOMO.
Pulse tool: Cm/Cmk ISO, SPC, CAM/Cpk CNOMO and Calibration.
It is possible to save two inspections with the same name and the same target objet. A warning message is displayed to inform the operator that an inspection with the same name already exists.
Select Yes to save the inspection.
Select No to cancel the inspection.
- Adding a Tool inspection
- Cm/Cmk ISO parameters
- SPC parameters
- ISO 6789:2003 parameters
- ISO 6789-2:2017 parameters
- ISO 5393 parameters
- CAM/Cpk CNOMO parameters
- JJF 1610:2017 parameters
- Calibration parameters
- VDI/VDE 2465-2 - tool based parameters
- VDI/VDE 2465-2 - position based parameters
- Adding a multistep inspection
- Cm/Cmk multistep parameters
- CAM/Cpk CNOMO multistep parameters
- Adding a Tool check Inspection through the Template file
- Deleting Tool inspection
- Editing Tool inspection
- Running Tool inspection
- Calibrating Power Focus
- Calibrating PowerMACS
- Calibrating generic controllers
Adding a Tool inspection
In the Home page, tap Tools.
In the Tool page, tap a configured Tool.
On the upper part of the Edit tool page, tap Inspection.
On the upper-right corner of the Inspection category, tap Add
In the Test type window, select an inspection. In the following an example of the Add Cm/Cmk inspection page. The structure is the same for all the inspections, only the name of the categories change.

A
Categories
B
Save button
C
Parameters
In the General category of the Add inspection page, configure the inspection parameters.
On the upper part of the Add inspection page, tap another category and configure the displayed parameters.
To display the hidden categories, tap the More options icon ( ) and configure the available parameters.
The categories available change depending on the inspection type. Refer to the parameters description of each tool inspection.
On the upper part of the Add inspection, tap Picture. In this page the picture sent by external software is shown.
In the Picture category, it is possible to:
Add an image/video: on a USB storage device, save the image/video to use in a folder named media_items, connect the storage device to the STpad and tap the Add button on the right side of the Picture page. In the Add picture dialog box, select the image/video to load and click OK.
The maximum size of images is 5 MB, the maximum size of videos is 10 MB.Remove a picture: on the right side of the Picture page, tap the Remove button.
On the upper part of the Add inspection, tap Traceability.
In the Traceability category of the Add inspection page, configure the following parameters:
Verification code: type the verification code that must be entered or scanned when the inspection is run. This field is case-sensitive.
Verification code description: to guide the operator, type the description of the verification code dialog box that is displayed when the inspection is run.
Assignable causes: it is possible to:
List:
select an assignable causes list: tap the Search icon (
) and then select an already configured item in the Assignable causes list page.add a new assignable causes list: tap the Search icon (
); on the upper-right corner of the Assignable causes list page, tap Add to configure a new item.delete the link to the assignable causes list: tap the Delete icon (
).
Mandatory: if the check box is selected, the operator must select/type an assignable cause to continue the test.
Force selection from list: select between:
No: the operator can type the assignable cause, without selecting it from the list.
Yes: the operator can only select the assignable cause from the list.
Inherit: the selection from list can be forced or not forced, depending on the definition of this parameter in the Assignable causes list page.
Corrective actions: it is possible to:
List:
select a corrective actions list: tap the Search icon (
) and then select an already configured item in the Corrective actions list page.add a new corrective actions list: tap the Search icon (
); on the upper-right corner of the Corrective actions list page, tap Add to configure a new item.delete the link to the corrective actions list: tap the Delete icon (
).
Mandatory: if the check box is selected, the operator must select/type a corrective action to continue the test.
Force selection from list: select between:
No: the operator can type the corrective action, without selecting it from the list.
Yes: the operator can only select the corrective action from the list.
Inherit: the selection from list can be forced or not forced, depending on the definition of this parameter in the Corrective actions list page.
On the upper-right corner of the Add inspection page, tap Save.
Cm/Cmk ISO parameters
General category
Name: type the name of the inspection.
Barcode identifier: it identifies the inspection. If left blank, the identifier corresponds to the inspection name.
Strategy: select the tool strategy to use.
The available strategies for each tool type are:Click, Cam-over for the click wrenches.
Direct driven, Only angle, Multistep for power tools.
Peak for peak tools.
Pulse tool, ACTA pulse for pulse tools.
Check type: select the check type from the drop down list. The available check types are:
Torque and angle
Only torque
Only angle
Angle and torque
For the Only angle strategy, only the Only angle check type is available.
For the Click and Cam-over strategies, only the Only torque check type is available.Free round: type the number of free rounds the tool performs to reach the proper operating speed before starting the test operation.
This parameter is available only for the Direct driven strategy.Joint: it is possible to:
select a joint: near the joint box, tap the Search icon (
) and then select an already configured joint in the Joints page.add a new joint: near the joint box, tap the Search icon (
). On the upper-right corner of the Joints page, tap Add to configure a new joint.delete the link to the joint: tap the Delete icon (
) near the joint box.
If the joint is linked to the inspection, the Target torque and Target angle are the values defined in the joint configuration.
If the joint is not linked to the inspection, type the torque and angle values in the respective pages.Number of samples: type the number of results to do.
The value can range from 0 to 1000. If the number of sample is not defined or equal to 0, the test is run with no batch count.Cm Cmk minimum samples number: minimum number of samples to display the result status. This value is set in the Inspection default values page.
Auto restart: select the checkbox to enable the automatic restart of the batch count when it is completed.
Measuring device type: select the measuring device which runs the test. Below are the available measuring devices:
Manual selection
STbench
IRC-Connect
Measurement device S/N: type the serial number of the measuring device connected to the device.
STbench channel: select the STbench channel to use to do the test. The available options are:
Manual selection.
Number of the STbench channel (from 1 to 8).
This parameter is available only if STbench is selected as measuring device.
Transducer S/N: type the serial number of the transducer linked to the measuring device connected to the device.
Filter frequency: type the value of the filter frequency. The allowed range is from 100 Hz to 2000 Hz. The default value is 500 Hz.
Tightening direction: from the drop down list select the tightening direction. The available options are:
Clockwise
Counterclockwise
Open Protocol ID: type the Open Protocol ID or tap on the Search icon (
).
Torque category
Below is a list of all the torque parameters available for the Cm/Cmk Inspection.
The parameters displayed by the device in the Torque category of each Cm/Cmk inspection change according to the Tool type and Strategy selected.
Cycle complete: the default value is managed by the measuring device and it is indicated as Automatic value.
It is possible to type the cycle complete value; it must be lower/equal to the cycle start.Cycle start: the default value is managed by the measuring device and it is indicated as Automatic value.
It is possible to type the cycle start value; it must be higher than the transducer Minimum Load and lower/equal to the Final angle monitoring torque.
If the Cycle start is set to zero, the device gives automatically a Cycle Start equal to the transducer Minimum Load.Measure angle from: from the drop-down list, select between:
One step: the measurement of the angle starts as soon as the Final monitoring torque value is reached.
Second step: the measurement of the angle starts in the second step, when the Final angle monitoring torque value is reached.
Starting second step: the measurement of the angle starts at the starting of the second step.
This parameter is available only for power tools.
Final angle monitoring torque: the default value is managed by the measuring device and it is indicated as Automatic value and corresponds to the lowest value between [50% of the target torque] and the [minimum torque].
It is possible to type the final angle monitoring torque value; it must be lower/equal to the Minimum torque.
If a Joint is linked to the inspection, this is an unavailable value equal to the Final angle monitoring torque defined in the Joint configurationControl mode: select how to define the torque limits. The available options are:
Min/Max
Target/tolerance
Minimum torque: type the value of the minimum value of the torque.
If a Joint is linked to the inspection, this is an unavailable value equal to the minimum torque defined in the Joint configuration.Target torque: type the value of the target torque. This parameter is available if the Control mode is set to Target/Tolerance.
If a Joint is linked to the inspection, this is an unavailable value equal to the Target torque defined in the Joint configuration.Maximum torque: type the value of the maximum value of the torque.
If a Joint is linked to the inspection, this is an unavailable value equal to the Maximum torque defined in the Joint configuration.Torque tolerance: type the value of the tolerance of the torque. This parameter is available if the Control mode is set to Target/Tolerance.
If a Joint is linked to the inspection, this is an unavailable value equal to the Torque tolerance defined in the Joint configuration.Measure torque at: from the drop down list, select one of the following options:
Torque peak
Angle peak
Slip torque: the default value is managed by the device and it is indicated as Automatic value. It is possible to type a value of the slip torque smaller/equal to the Target torque.
Minimum Cm Torque: type the minimum value of the Cm index for the torque.
Minimum Cm Torque ranges from 0 to 9999.Minimum Cmk Torque: type the minimum value of the Cmk index for the torque.
Minimum Cmk Torque ranges from 0 to 9999.Unit of measurement: select the unit of measurement to use.
If a Joint is linked to the inspection, this is an unavailable value equal to the Unit of measurement selected in the Joint configuration.
Angle category
Below is a list of all the angle parameters available for the Cm/Cmk Inspection.
The parameters displayed by the device in the Angle category of each Cm/Cmk inspection change according to the Check type selected.
This category is not displayed for Pulse tools.
Control mode: select how to define the angle limits. The available options are:
Min/Max
Target/tolerance
Minimum angle: type the minimum value of the angle.
If a Joint is linked to the inspection, this is an unavailable value set to the Minimum angle defined in the Joint configuration.Target angle: type the value of target angle. This parameter is available if the Control mode is set to Target/Tolerance.
If a Joint is linked to the inspection, this is an unavailable value set to the Target angle defined in the Joint configuration.Maximum angle: type the maximum value of the angle.
If a Joint is linked to the inspection, this is an unavailable value set to the Maximum angle defined in the Joint configuration.Angle tolerance: type the value of the tolerance of the angle. This parameter is available if the Control mode is set to Target/Tolerance.
If a Joint is linked to the inspection, this is an unavailable value set to the Angle tolerance defined in the Joint configuration.Minimum Cm Angle: type the minimum value of the Cm index for the angle.
Minimum Cm Angle ranges from 0 to 9999.Minimum Cmk Angle: type the minimum value of the Cmk index for the angle.
Minimum Cmk Angle ranges from 0 to 9999.
Time category
Below is a list of all the time parameters available for the Cm/Cmk Inspection.
The parameters displayed by the device in the Time category of each Cm/Cmk inspection change according to the Tool type and Strategy selected.
Measure delay time: type the value of the measure delay time.
During the measure delay time the torque trace is not analyzed and the click-point is not detected.
The measure delay time ranges from 0.0 s to 5.0 s.Reset time: type the value of the reset time.
During the reset time, the torque trace is not analyzed.
The reset time ranges from 0.0 s to 5.0 s.Relaxation time: in case of wrenches that do not save the torque peak, type a value greater than the mechanical relaxation of the wrench. In case of wrenches that do save the torque peak, leave this parameter at 0.
The maximum value is 5 s.End cycle time: if Relaxation time = 0, the End cycle time starts when the torque goes and remains below the Cycle complete for the given time. If Relaxation time > 0, the End cycle time starts when the Relaxation time expires.
The default value is 0.4 s.
Pulse category
This category is displayed only for the Pulse tools.
Minimum pulse: minimum number of pulses to be done by the tool during the test.
Maximum pulse: Maximum number of pulses to be done by the tool during the test.
SPC parameters
General category
Name: type the name of the inspection.
Barcode identifier: it identifies the inspection. If left blank, the identifier corresponds to the inspection name.
Strategy: select the tool strategy to use. The available strategies for each tool type are
Click, Cam-over for click wrenches.
Direct driven, Only angle for power tools.
Peak for peak tools.
Pulse tool, ACTA pulse tool for pulse tools.
Check type: from the drop down list, select the check type. The available check types are:
Torque and angle
Only torque
Only angle
Angle and torque
For the Only angle strategy, only the Only angle check type is available.
For the Click and Cam-over strategies, only the Only torque check type is available.
Two step: select the check box to enable the dual step strategy of the tool.
This parameter is available only for Direct driven strategy.
Free round: type the number of free rounds the tool performs to reach the proper operating speed before starting the test operation.
This parameter is available only for the Direct driven strategy.
Joint: it is possible to:
select a joint: near the joint box, tap the Search icon (
) and then select an already configured joint in the Joints page.add a new joint: near the joint box, tap the Search icon (
). On the upper-right corner of the Joints page, tap Add to configure a new joint.delete the link to the joint: tap the Delete icon (
) near the joint box.
If the joint is linked to the inspection, the Target torque and Target angle are the values defined in the joint configuration.
If the joint is not linked to the inspection, type the torque and angle values in the respective pages.
Subgroup size: type the number of results on which the statistics are calculated. The subgroup size ranges from 1 to 25.
Subgroup frequency: type the frequency of the averages displayed in the X chart and in the SPC rules.
For example:
Subgroup Frequency = 1: all subgroups are considered.
Subgroup Frequency = 2: one subgroup every 2 subgroups is considered.
Subgroup Frequency = X: one subgroup every X subgroups is considered
Number of samples: type the number of results to do.
The value can range from 0 to 1000. If the number of sample is not defined or equal to 0, the test is run with no batch count.
Auto restart: select the checkbox to enable the automatic restart of the batch count when it is completed.
Measurement device type: select the measuring device which runs the test.
Below are the available measuring devices:
Manual selection
STbench
IRC-Connect
Measurement device S/N: type the serial number of the measuring device connected to the device.
STbench channel: select the STbench channel to use to do the test. The available options are:
Manual selection.
Number of the STbench channel (from 1 to 8).
This parameter is available only if STbench is selected as measuring device.
Transducer S/N: type the serial number of the transducer linked to the measuring device connected to the device.
Filter frequency: type the value of the filter frequency. The allowed range is from 100 to 2000 Hz. The default value is 500 Hz.
Tightening direction: from the drop down list select the tightening direction. The available items are:
Clockwise
Counterclockwise
Torque category
Below is a list of all the torque parameters available for the SPC inspection.
The parameters displayed by the device in the Torque category of each SPC inspection change according to the Tool type and Strategy selected.
Cycle complete: the default value is managed by the measuring device and it is indicated as Automatic value.
It is possible to type the cycle complete value; it must be lower/equal to the cycle start.
Cycle start: the default value is managed by the measuring device and it is indicated as Automatic value.
It is possible to type the cycle start value; it must be higher than the transducer Minimum Load and lower/equal to the Final angle monitoring torque.
If the Cycle start is set to zero, the device gives automatically a Cycle Start equal to the transducer Minimum Load.
Measure angle from: from the drop-down list, select between:
One step: the measurement of the angle starts as soon as the Final monitoring torque value is reached.
Second step: the measurement of the angle starts in the second step, when the Final angle monitoring torque value is reached.
Starting second step: the measurement of the angle starts at the starting of the second step.
This parameter is available only for power tools.
Final angle monitoring torque: the default value is managed by the measuring device and it is indicated as Automatic value and corresponds to the lowest value between [50% of the target torque] and the [minimum torque].
It is possible to type the final angle monitoring torque value; it must be lower/equal to the Minimum torque.
If a Joint is linked to the inspection, this is an unavailable value equal to the Final angle monitoring torque defined in the Joint configuration.
Control mode: select how to define the torque limits. The available options are:
Min/Max
Target/tolerance
Minimum torque: type the value of the minimum value of the torque.
If a Joint is linked to the inspection, this is an unavailable value equal to the minimum torque defined in the Joint configuration.
Target torque: type the value of the target torque. This parameter is available if the Control mode is set to Target/Tolerance.
If a Joint is linked to the inspection, this is an unavailable value equal to the Target torque defined in the Joint configuration.
Maximum torque: type the value of the maximum value of the torque.
If a Joint is linked to the inspection, this is an unavailable value equal to the Maximum torque defined in the Joint configuration.
Torque tolerance: type the value of the tolerance of the torque. This parameter is available if the Control mode is set to Target/Tolerance.
If a Joint is linked to the inspection, this is an unavailable value equal to the Torque tolerance defined in the Joint configuration.
Measure torque at: from the drop down list, select one of the following options:
Torque peak
Angle peak
Slip torque: the default value is managed by the device and it is indicated as Automatic value. It is possible to type a value of the slip torque smaller/equal to the Target torque.
Unit of measurement: select the unit of measurement to use.
If a Joint is linked to the inspection, this is an unavailable value equal to the Unit of measurement selected in the Joint configuration.
Angle category
Below is a list of all the angle parameters available for the SPC inspection.
The parameters displayed by the device in the Time category of each SPC inspection change according to the Check type selected.
This category is not displayed for the Pulse tools.
Control mode: select how to define the angle limits. The available options are:
Min/Max
Target/tolerance
Minimum angle: type the minimum value of the angle.
If a Joint is linked to the inspection, this is an unavailable value set to the Minimum angle defined in the Joint configuration.
Target angle: type the value of target angle. This parameter is available if the Control mode is set to Target/Tolerance
If a Joint is linked to the inspection, this is an unavailable value set to the Target angle defined in the Joint configuration.
Maximum angle: type the maximum value of the angle.
If a Joint is linked to the inspection, this is an unavailable value set to the Maximum angle defined in the Joint configuration.
Angle tolerance: type the value of the tolerance of the angle. This parameter is available if the Control mode is set to Target/Tolerance.
If a Joint is linked to the inspection, this is an unavailable value set to the Angle tolerance defined in the Joint configuration.
Time category
Below is a list of all the time parameters available for the SPC inspection.
The parameters displayed by the device in the Torque category of each SPC inspection change according to the Tool type and Strategy selected.
Measure delay time: type the value of the measure delay time.
During the measure delay time the torque trace is not analyzed and the click-point is not detected.
The measure delay time ranges from 0.0 s to 5.0 s.
Reset time: type the value of the reset time.
During the reset time, the torque trace is not analyzed.
The reset time ranges from 0.0 s to 5.0 s.
End cycle time: type the value of the end cycle time.
The “quick programming” test stops when the torque continues to be applied but it is under the Cycle complete for a time longer than the End cycle time.
The end cycle time ranges from 0.1 s to 5.0 s.
Pulse category
This category is displayed only for the Pulse tools.
Minimum pulse: minimum number of pulses to be done by the tool during the test.
Maximum pulse: Maximum number of pulses to be done by the tool during the test.
ISO 6789:2003 parameters
The ISO 6789:2003 test is available for tool types Click wrench and Peak.
General category
Name: type the name of the inspection.
Barcode identifier: it identifies the inspection. If left blank, the identifier corresponds to the inspection name.
Measurement device type: STbench is the only measurement device type available for this test strategy.
Measurement device S/N: type the serial number of the measuring device connected to the device.
Tightening direction: from the drop down list select the tightening direction. The available options are:
Clockwise
Counterclockwise
Disable manual insert: select the check box to set the value measured by the wrench automatically as the target torque of the phase (defined by the standard ISO 6789:2003) of the maximum of the torque range of the tool.
This parameter is shown only for Peak tools.
Phase 1 category
Target torque: unavailable value. The target torque is equal to a percentage value of the maximum capacity of the tool. This parameter is defined by the ISO 6789:2003 standard.
Torque tolerance: unavailable value. The torque tolerance is equal to percentage value defined by the ISO 6789:2003 standard.
Number of samples: unavailable value. The number of results to do it is equal to 5. This value is defined by the ISO 6789:2003 standard.
STbench channel: select the STbench channel to use to do the test. The available options are:
Manual selection.
Number of the STbench channel (from 1 to 8).
Transducer S/N: type the serial number of the transducer linked to the measuring device connected to the device.
Each wrench type defined by the ISO 6789:2003 standard has a different number of test points and different target torque. All the test points have the same configuration of the Phase 1 described above.
Refer to the ISO 6789:2003 standard for more information.
ISO 6789-2:2017 parameters
The ISO 6789-2:2017 inspection is available only for tools Type I - Peak wrench and Type II - Click wrench.
General category
Name: type the name of the inspection.
Barcode identifier: it identifies the inspection. If left blank, the identifier corresponds to the inspection name.
Measuring device type: STbench is the only measuring device type available for this test strategy.
Measuring device S/N: type the serial number of the measuring device connected to the device.
Tightening direction: from the drop down list select the tightening direction. The available items are:
Clockwise
Counterclockwise
Disable manual insert: if selected, the wrench torque readings are automatically populated with the Target torque value of the test. If unselected, the wrench torque readings must be typed manually.
Available only for Type I wrenches.Relaxation time: in case of wrenches that do not save the torque peak, type a value greater than the mechanical relaxation of the wrench. In case of wrenches that do save the torque peak, leave this parameter at 0.
The maximum value is 5 s. Available only for Type I wrenches.End cycle time: if Relaxation time = 0, the End cycle time starts when the torque goes and remains below the Cycle complete for the given time. If Relaxation time > 0, the End cycle time starts when the Relaxation time expires.
The default value is 0.4 s. Available only for Type I wrenches.Expected measurement error (as): type the expected measurement error.
Expected relative uncertainty interval (W'): type the expected relative uncertainty interval.
Preload: select the checkbox to enable the preload measurements.
Measurement sequence 1 category
Target torque: this parameter is defined in the ISO 6789-2:2017 standard. For Type I wrenches and for classes A, C, D, F and G of Type II, the target torque is equal to the tool minimum capacity; for classes B and E of Type II, the target torque is equal to the tool maximum capacity.
The target torque field is available only for classes C and F of Type II.Maximum deviation: unavailable value. The percentage of maximum deviation is equal to 4%. This value is defined in the ISO 6789-2:2017 standard.
Number of samples: unavailable value. The number of results to do it is equal to 5. This value is defined in the ISO 6789-2:2017 standard.
STbench channel: select the STbench channel to use to do the test. The available options are:
Manual selection.
Number of the STbench channel (from 1 to 8).
Transducer S/N: type the serial number of the transducer linked to the measuring device connected to the device.
Measurement sequence 2 category and Measurement sequence 3 category are available for Type I wrenches and for the classes A, D and G of Type II and have the same structure of the Measurement sequence 1 category, only the target torque changes.
In Measurement sequence 2, the target torque is set to the 60% of the tool maximum capacity.
In Measurement sequence 3, the target torque is set to the 100% of the tool maximum capacity.
ISO 5393 parameters
The ISO 5393 test is available only for Power tools.
General category
Name: type the name of the inspection.
Barcode identifier: it identifies the inspection. If left blank, the identifier corresponds to the inspection name.
Measurement device type: STbench is the only measurement device type available for this test strategy.
Measurement device S/N: type the serial number of the measuring device connected to the device.
Number of samples: type the number of results to do.
The number of samples ranges from 5 to 99.
Tightening direction: from the drop down list select the tightening direction. The available items are Clockwise and Counterclockwise.
Free rounds: type the number of free rounds the tool performs to reach the proper operating speed before starting the test operation.
Upper torque category
Upper test torque level: specified upper mean torque level attainable on a low torque-rate joint in accordance with this International Standard.
Measure angle from: from the drop-down list, select between:
One step:the measurement of the angle starts as soon as the Final monitoring torque value is reached.
Second step: the measurement of the angle starts in the second step, when the Final angle monitoring torque value is reached.
Starting second step: the measurement of the angle starts at the starting of the second step.
Final angle monitoring torque: type the final angle monitoring torque value.
The final angle monitoring torque must be equal or higher than the Minimum torque.
Hard joint angle: the test shall include a joint having a low torque rate and a joint having a high torque rate. On a high torque-rate joint (“hard joint”), the tightening is accomplished in a fraction of a revolution. The high torque-rate joint shall be such that the torque increase from 10% to 100% of the test torque level corresponds to an angular displacement of 27°.
Soft joint angle: the test shall include a joint having a low torque rate and a joint having a high torque rate. On a low torque-rate joint (“soft joint”), the tightening is usually accomplished with several revolutions of the fastener. The low torque-rate joint shall be such that the torque increase from 10% to 100% of the test torque level corresponds to an angular displacement of not less than 650°.
Transducer S/N: type the serial number of the transducer linked to the measuring device connected to the device.
STbench channel: select the STbench channel to use to do the test. The available options are:
Manual selection.
Number of the STbench channel (from 1 to 8).
Lower torque category
Lower test torque level: specified lower mean torque level attainable on a low torque-rate joint in accordance with this International Standard.
Measure angle from: from the drop-down list, select between:
One step: the measurement of the angle starts as soon as the Final monitoring torque value is reached.
Second step: the measurement of the angle starts in the second step, when the Final angle monitoring torque value is reached.
Starting second step: the measurement of the angle starts at the starting of the second step.
Final angle monitoring torque: type the final angle monitoring torque value.
The final angle monitoring torque must be equal or higher than the minimum torque.
Hard joint angle: the test shall include a joint having a low torque rate and a joint having a high torque rate. On a high torque-rate joint (“hard joint”), the tightening is accomplished in a fraction of a revolution. The high torque-rate joint shall be such that the torque increase from 10% to 100% of the test torque level corresponds to an angular displacement of 27°.
Soft joint angle: the test shall include a joint having a low torque rate and a joint having a high torque rate. On a low torque-rate joint (“soft joint”), the tightening is usually accomplished with several revolutions of the fastener. The low torque-rate joint shall be such that the torque increase from 10% to 100% of the test torque level corresponds to an angular displacement of not less than 650°.
Transducer S/N: itype the serial number of the transducer linked to the measuring device connected to the device.
STbench channel: select the STbench channel to use to do the test. The available options are:
Manual selection.
Number of the STbench channel (from 1 to 8).
CAM/Cpk CNOMO parameters
General category
Name: type the name of the inspection.
Barcode identifier (*): it identifies the inspection. If left blank, the identifier corresponds to the inspection name.
Strategy: select the tool strategy to use.
Strategy: select the tool strategy to use. The available strategies for each tool type are:
Click, Cam-over for the click wrenches.
Direct driven, Only angle, Multistep for power tools.
Peak for peak tools.
Pulse tool, ACTA pulse tool for pulse tools.
Check type: select the check type from the drop down list. The available check types are:
Torque and angle
Only torque
Only angle
Angle and torque
For the Only angle strategy, only the Only angle check type is available.
For the Click and Cam-over strategies, only the Only torque check type is available.
Free round: type the number of free rounds the tool performs to reach the proper operating speed before starting the test operation.
This parameter is available only for the Direct driven strategy.
Joint: it is possible to:
select a joint: near the joint box, tap the Search icon (
) and then select an already configured joint in the Joints page.add a new joint: near the joint box, tap the Search icon (
). On the upper-right corner of the Joints page, tap Add to configure a new joint.delete the link to the joint: tap the Delete icon (
) near the joint box.
If the joint is linked to the inspection, the Target torque and Target angle are the values defined in the joint configuration.
If the joint is not linked to the inspection, type the torque and angle values in the respective pages.
Number of samples: type the number of results to do. This parameters must be a number multiple of 5 withing the range from 15 to 95
Measurement device type: select the measuring device which runs the test.
Below are the available measuring devices:
Manual selection
STbench
IRC-Connect
Measurement device S/N: type the serial number of the measuring device connected to the device.
STbench channel: select the STbench channel to use to do the test. The available options are:
Manual selection.
Number of the STbench channel (from 1 to 8).
This parameter is available only if STbench is selected as measuring device.
Transducer S/N: type the serial number of the transducer linked to the measuring device connected to the device.
Filter frequency: type the value of the filter frequency. The allowed range is from 100 to 2000 Hz. The default value is 500 Hz.
Tightening direction: from the drop down list select the tightening direction. The available items are Clockwise and Counterclockwise.
Torque category
Below is a list of all the torque parameters available for the CAM/Cpk Inspection.
The parameters displayed by the device in the Torque category of each CAM/Cpk inspection change according to the Tool type and Strategy selected.
Cycle complete: the default value is managed by the measuring device and it is indicated as Automatic value.
It is possible to type the cycle complete value; it must be lower/equal to the cycle start.
Cycle start: the default value is managed by the measuring device and it is indicated as Automatic value.
It is possible to type the cycle start value; it must be higher than the transducer Minimum Load and lower/equal to the Final angle monitoring torque.
If the Cycle start is set to zero, the device gives automatically a Cycle Start equal to the transducer Minimum Load.
Measure angle from: from the drop-down list, select between:
One step: the measurement of the angle starts as soon as the Final monitoring torque value is reached.
Second step: the measurement of the angle starts in the second step, when the Final angle monitoring torque value is reached.
Starting second step: the measurement of the angle starts at the starting of the second step.
This parameter is available only for power tools.
Final angle monitoring torque: the default value is managed by the measuring device and it is indicated as Automatic value and corresponds to the lowest value between [50% of the target torque] and the [minimum torque].
It is possible to type the final angle monitoring torque value; it must be lower/equal to the Minimum torque.
If a Joint is linked to the inspection, this is an unavailable value equal to the Final angle monitoring torque defined in the Joint configuration.
Control mode: select how to define the torque limits. The available options are:
Min/Max
Target/tolerance
Minimum torque: type the value of the minimum value of the torque.
If a Joint is linked to the inspection, this is an unavailable value equal to the minimum torque defined in the Joint configuration.
Target torque: type the value of the target torque. This parameter is available if the Control mode is set to Target/Tolerance.
If a Joint is linked to the inspection, this is an unavailable value equal to the Target torque defined in the Joint configuration.
Maximum torque: type the value of the maximum value of the torque.
If a Joint is linked to the inspection, this is an unavailable value equal to the Maximum torque defined in the Joint configuration.
Torque tolerance: type the value of the tolerance of the torque. This parameter is available if the Control mode is set to Target/Tolerance.
If a Joint is linked to the inspection, this is an unavailable value equal to the Torque tolerance defined in the Joint configuration.
Measure torque at: from the drop down list, select one of the following options:
Torque peak
Angle peak
Slip torque: the default value is managed by the device and it is indicated as Automatic value. It is possible to type a value of the slip torque smaller/equal to the Target torque.
Minimum CAM Torque: type the minimum value of the CAM index for the torque.
Minimum CAM Torque ranges from 0 to 9999.
Minimum Cpk Torque: type the minimum value of the Cpk index for the torque.
Minimum Cpk Torque ranges from 0 to 9999.
Unit of measurement: select the unit of measurement to use.
If a Joint is linked to the inspection, this is an unavailable value equal to the Unit of measurement selected in the Joint configuration.
Angle category
Below is a list of all the angle parameters available for the CAM/Cpk Inspection.
The parameters displayed by the device in the Time category of each CAM/Cpk inspection change according to the Check type selected.
Control mode: select how to define the angle limits. The available options are:
Min/Max
Target/tolerance
Minimum angle: type the minimum value of the angle.
If a Joint is linked to the inspection, this is an unavailable value set to the Minimum angle defined in the Joint configuration.
Target angle: type the value of target angle. This parameter is available if the Control mode is set to Target/Tolerance
If a Joint is linked to the inspection, this is an unavailable value set to the Target angle defined in the Joint configuration.
Maximum angle: type the maximum value of the angle.
If a Joint is linked to the inspection, this is an unavailable value set to the Maximum angle defined in the Joint configuration.
Angle tolerance: type the value of the tolerance of the angle. This parameter is available if the Control mode is set to Target/Tolerance.
If a Joint is linked to the inspection, this is an unavailable value set to the Angle tolerance defined in the Joint configuration.
Minimum CAM angle: type the minimum value of the CAM index for the angle.
Minimum CAM Angle ranges from 0 to 9999.
Minimum Cpk angle: type the minimum value of the Cpk index for the angle.
Minimum Cpk Angle ranges from 0 to 9999.
Time category
Below is a list of all the time parameters available for the CAM/Cpk Inspection.
The parameters displayed by the device in the Torque category of each CAM/Cpk inspection change according to the Tool type and Strategy selected.
Measure delay time: type the value of the measure delay time.
During the measure delay time the torque trace is not analyzed and the click-point is not detected.
The measure delay time ranges from 0.0 s to 5.0 s.
Reset time: type the value of the reset time.
During the reset time, the torque trace is not analyzed.
The reset time ranges from 0.0 s to 5.0 s.
End cycle time: type the value of the end cycle time.
The “quick programming” test stops when the torque continues to be applied but it is under the Cycle complete for a time longer than the End cycle time.
The end cycle time ranges from 0.1 s to 5.0 s.
Pulse category
This category is displayed only for the Pulse tools.
Minimum pulse: minimum number of pulses to be done by the tool during the test.
Maximum pulse: Maximum number of pulses to be done by the tool during the test.
JJF 1610:2017 parameters
The JJF 1610:2017 inspection is available only for Power tools.
General category
Name: type the name of the inspection.
Barcode identifier (*): it identifies the inspection. If left blank, the identifier corresponds to the inspection name.
Measuring device type: select the measuring device which runs the test. Below are the available options:
Manual selection
STbench
IRC-Connect
Measuring device S/N: type the serial number of the measuring device connected to the device.
Number of samples: type the number of results to do during the test. This parameter ranges from 5 to 99. By default, the number of samples is set to 10.
Tightening direction: from the drop down list, select the tightening direction. The available items are Clockwise and Counterclockwise.
Free rounds: type the number of free rounds the tool performs to reach the proper operating speed before starting the test operation. By default, the number of free rounds is set to 3.
Filter frequency: type the value of the filter frequency. This parameter ranges from 100 Hz to 2000 Hz. By default, the filter frequency is set to 500 Hz.
Preload: select the checkbox to enable the preload measurements.
Calibration point 1 category
Target torque: this parameter is defined in the JJF 1610:2017 standard. The default value of the target torque is equal to the tool minimum capacity.
Measure angle from: from the drop-down list, select between:
One step: the measurement of the angle starts as soon as the Final monitoring torque value is reached.
Second step: the measurement of the angle starts in the second step, when the Final angle monitoring torque value is reached.
Starting second step: the measurement of the angle starts at the starting of the second step.
Final angle monitoring: the default value of the final angle monitoring is half of the target torque.
Hard joint angle: the default value of the hard joint angle is equal to 15.0 °.
Soft joint angle: the value of the soft joint angle is equal to 360.0 °.
Transducer S/N: type the serial number of the transducer linked to the measuring device connected to the device.
Calibration point 2 category and Calibration point 3 category have the same structure of Calibration point 1, only the target torque changes.
In Calibration point 2 category, the target torque is set to the 60% of the tool maximum capacity.
In Calibration point 3 category, the target torque is set to the 100% of the tool maximum capacity.
To run only the Calibration point 1 phase of the inspection, tap on the Calibration point 3 category and unselect the Enabled check box. Then, tap on the Calibration point 2 category and unselect the Enabled checkbox.
Calibration parameters
If the Power tool is not linked to a controller, Calibration is not available in the Test type window.
General category
Name: type the name of the inspection.
Barcode identifier: it identifies the inspection. If left blank, the identifier corresponds to the inspection name.
Strategy: select the tool strategy to use. The available strategies are:
Pulse tool
ACTA pulse tool
Available only for Pulse tools.
Number of samples: it specifies how many times the test is going to be run. The maximum number of samples is 99.
Torque tolerance: it defines the maximum percent difference between the average torque of the controller and the average torque of the device. It is expressed in percentage. By default the torque tolerance is equal to 5%. Available only for Power tools.
Angle tolerance: it defines the maximum percent difference between the average angle of the controller and the average angle of the device. It is expressed in percentage. By default the torque tolerance is equal to 5%. Available only for Power tools.
Power MACS mode (predefined calibration program): type the controller mode.
Available only for Power tools.Measuring device type: select the measuring device which runs the test. Below are the available options:
Manual selection
STbench
IRC-Connect
Filter frequency: type the value of the filter frequency. The allowed range is from 100 Hz to 2000 Hz. The default value is 850 Hz.
Available only for Pulse tools.Tightening direction: from the drop down list select the tightening direction. The available options are:
Clockwise
Counterclockwise
Available only for Pulse tools.
Controller category
The Controller category is available only for Power tools.
Type: it cannot be modified in this section: it is a parameter of the Controller. For more information about how to update the controller type, see the chapter Controllers.
Synchronization mode: select between the following:
Manual selection
Manual
Ethernet. This option is not available if the controller type is PowerMACS.
Serial
In case Manual selection is selected, during the calibration of the power tool with the controller, after tapping Play, a synchronization mode dialog box appears. Select the synchronization mode to continue the calibration process.
Serial number: it cannot be modified in this section: it is a parameter of the Controller. For more information about how to update the serial number of the controller, see the chapter Controllers.
IP Address: it cannot be modified in this section: it is a parameter of the Controller. This parameter is not available if the controller type is PowerMACS. For more information about how to update the IP Address of the controller, see the chapter Controllers.
Port number: it cannot be modified in this section: it is a parameter of the Controller. This parameter is not available if the controller type is PowerMACS. For more information about how to update the port number of the controller, see the chapter Controllers
Baud rate: it cannot be modified in this section: it is a parameter of the Controller. For more information about how to update the baud rate, see the chapter Controllers.
Joint category
The Joint category is available only for Power tools linked to Power Focus or Generic controller.
On the upper-right corner of the Joint category page, tap Save directly (none of the joints is selected). The device makes automatically a standard joint that permits to do the calibration inspection.
In the joint selection workspace, select the check box for manually selecting the joint that permits to do the calibration inspection. The following is displayed:
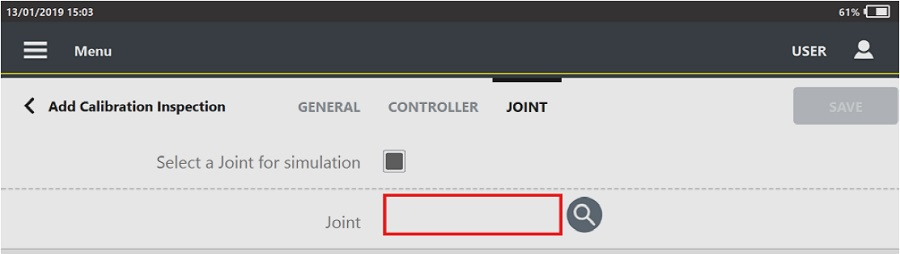
Tap the search icon (
) and select/create a joint, according to customer needs.
Torque category
The Torque category is available only for Pulse tools.
Torque correction: type the coefficient for torque correction.
The default value is 1. Available only for Pulse strategy.Torque tolerance: it defines the maximum percent difference between the average torque of the controller and the average torque of the device. It is expressed in percentage. By default the torque tolerance is equal to 5%.
Time category
The Time category is available only for Pulse tools.
Measure delay time: type the value of the measure delay time.
During the measure delay time the torque trace is not analyzed and the click-point is not detected.
The measure delay time ranges from 0.0 s to 5.0 s. Available only for ACTA pulse strategy.Reset time: type the value of the reset time.
During the reset time, the torque trace is not analyzed.
The reset time ranges from 0.0 s to 5.0 s. Available only for ACTA pulse strategy.End cycle time: type the value of the end cycle time. The test stops when the torque continues to be applied but it is under the Cycle complete for a time longer than the End cycle time.
The end cycle time ranges from 0.1 s to 5.0 s.
VDI/VDE 2465-2 - tool based parameters
In the Select method window, select one of the VDI/VDE 2645-2 method from M-201 to M-204.
General category
Method: name of the selected method. It is an unavailable field.
General condition: in the drop down list, select on one of the items.
Name: type the name of the inspection.
Barcode identifier: it identifies the inspection. If left blank, the identifier corresponds to the inspection name.
Measurement device type: STbench is the only measuring device type available.
Measurement device S/N: type the serial number of the measuring device.
Number of sample: type the number of results to do during the test. This parameter ranges from 25 to 50.
Tool minimum capacity tool: minimum torque value of the tool range.
Tool maximum capacity tool: maximum torque value of the tool range.
Change recommended tolerance limit: select the check box to edit the tolerance limit value for torque/angle.
Tightening direction: from the drop down list select the tightening direction. The available items are Clockwise and Counterclockwise.
Unit of measurement: select the unit of measurement to use.
Test point 1 and Test point 2 category
Measure angle from: from the drop-down list, select between:
One step: the measurement of the angle starts as soon as the Final monitoring torque value is reached.
Second step: the measurement of the angle starts in the second step, when the Final angle monitoring torque value is reached.
Starting second step: the measurement of the angle starts at the starting of the second step.
Torque tolerance: type the percentage of the tolerance torque.
This field is available if in General category, the Change recommended tolerance limit check box is selected.
STbench channel: select the STbench channel to use to do the test. The available options are:
Manual selection
Number of the STbench channel (from 1 to 8)
Transducer S/N: type the serial number of the transducer linked to the measuring device connected to the device.
For Test point 2, select the Recommended check box to enable the test point.
All the other parameters are not editable.
Test point 3 and Test point 4 category
Measure angle from: from the drop-down list, select between:
One step: the measurement of the angle starts as soon as the Final monitoring torque value is reached.
Second step: the measurement of the angle starts in the second step, when the Final angle monitoring torque value is reached.
Starting second step: the measurement of the angle starts at the starting of the second step.
Angle tolerance: type the degrees of the tolerance angle.
This field is available if in General category, the Change recommended tolerance limit check box is selected.
STbench channel: select the STbench channel to use to do the test. The available options are:
Manual selection
Number of the STbench channel (from 1 to 8)
Transducer S/N: type the serial number of the transducer linked to the measuring device connected to the device.
All the other parameters are not editable.
For Test point 4, select the Recommended check box to enable the test point.
In the upper part of the Add VDI/VDE 2645-2 inspection page, click the More options button () to select the Test point 4.
VDI/VDE 2465-2 - position based parameters
In the Select method page, select one of the VDI/VDE 2645-2 method from M-205 to M-208.
General category
Method: name of the selected method. It is an unavailable field.
General condition: in the drop down list, select on one of the items.
Name: type the name of the inspection.
Barcode identifier: it identifies the inspection. If left blank, the identifier corresponds to the inspection name.
Test point type: from the drop down list, select one of the followings items:
Torque.
Angle.
Torque and angle.
This items are enabled according to the selected method. For example, for method 205 only Torque is available.
Measurement device type: from the drop down list, select the measuring devices. The available options are:
Manual selection.
STbench.
IRC-Connect.
Measurement device S/N: type the serial number of the measuring device.
Number of sample: type the number of results to do during the test. Its range is from 25 to 50.
Change recommended tolerance limit: select the check box to edit the tolerance limit value for torque/angle.
Unit of measurement: select the unit of measurement to use.
Test point torque category
The Test point torque is available if the Test point type is set to Torque or Torque and angle,
Joint: it is possible to:
select a joint: near the joint box, tap the Search icon (
) and then select an already configured joint.add a new joint: near the joint box, tap the Search icon (
). On the upper-right corner of the Joint page, tap Add to configure a new joint.
Measure angle from: from the drop-down list, select between:
One step: the measurement of the angle starts as soon as the Final monitoring torque value is reached.
Second step: the measurement of the angle starts in the second step, when the Final angle monitoring torque value is reached.
Starting second step: the measurement of the angle starts at the starting of the second step.
STbench channel: from the drop down list, select the STbench channel to use.
This item is available only if STbench is selected as measuring device type.
Transducer S/N: type the transducer serial number, if the transducer is used during the test.
All the other parameters are not editable and their values are defined in the joint configuration.
Test point angle category
The Test point angle is available if the Test point type is set to Angle or Torque and angle,
Joint: it is possible to:
select a joint: near the joint box, tap the Search icon (
) and then select an already configured joint.add a new joint: near the joint box, tap the Search icon (
). On the upper-right corner of the Joint page, tap Add to configure a new joint.
STbench channel: from the drop down list, select the STbench channel to use.
This item is available only if STbench is selected as measuring device type.
Transducer S/N: type the transducer serial number, if the transducer is used during the test.
All the other parameters are not editable and their values are defined in the joint configuration.
Adding a multistep inspection
Multistep strategy is used when the tool performs multiple operations during the same tightening and those steps need to be evaluated.
In the Tool page, tap a configured power tool.
The Cm/Cmk multistep inspection is available only for Power tool
On the upper part of the Edit tool page, tap Inspection.
On the upper-right corner of the Inspection category, tap Add.
In the Test type window, select Cm/Cmk ISO. The following is displayed:
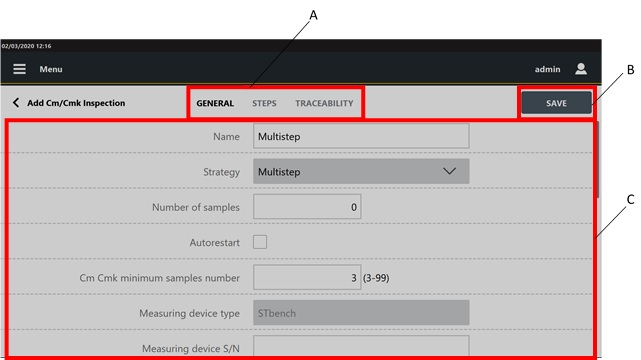
A
Categories
B
Save button
C
Parameters
In the General category of the Add Cm/Cmk inspection page, configure the displayed parameters
On the upper part of the Add Cm/Cmk inspection page, tap Steps.
On the upper-right corner of the Step 1 section of the Steps category, tap the Edit icon(
 ) to set the parameters related to a specific step.
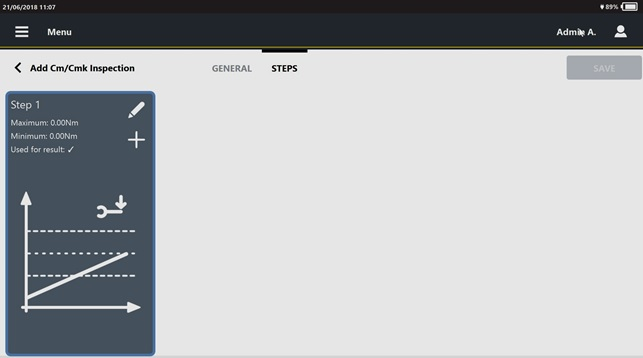
The following is displayed:

In the Edit step 1 dialog box, configure the step parameters.
On the lower-right corner of the Edit step 1 dialog box, tap OK.
To add a new step, tap the Add step icon (
 )
)The maximum number of steps allowed for each Inspection is equal to 30.
After the step is configured, in the Step section, the following information are shown:
Maximum: maximum value of the variable under test (torque/angle).
Minimum: minimum value of the variable under test (torque/angle).
Used for result: if the Used for result check box has been selected the icon
 is displayed.
Variable icon: if torque is selected as check type the following icon is shown:

If angle is selected as check type the following icon is shown:

On the upper part of the Add Cm/Cmk inspection, tap Picture. In this page the picture sent by external software is shown.
In the Picture category, it is possible to:
Add an image/video: on a USB storage device, save the image/video to use in a folder named media_items, connect the storage device to the STpad and tap the Add button on the right side of the Picture page. In the Add picture dialog box, select the image/video to load and click OK.
The maximum size of images is 5 MB, the maximum size of videos is 10 MB.Remove a picture: on the right side of the Picture page, tap the Remove button.
On the upper part of the Add inspection, tap Traceability.
In the Traceability category of the Add inspection page, configure the following parameters:
Verification code: type the verification code that must be entered or scanned when the inspection is run. This field is case-sensitive.
Verification code description: to guide the operator, type the description of the verification code dialog box that is displayed when the inspection is run.
Assignable causes: it is possible to:
List:
select an assignable causes list: tap the Search icon (
) and then select an already configured item in the Assignable causes list page.add a new assignable causes list: tap the Search icon (
); on the upper-right corner of the Assignable causes list page, tap Add to configure a new item.delete the link to the assignable causes list: tap the Delete icon (
).
Mandatory: if the check box is selected, the operator must select/type an assignable cause to continue the test.
Force selection from list: select between:
No: the operator can type the assignable cause, without selecting it from the list.
Yes: the operator can only select the assignable cause from the list.
Inherit: the selection from list can be forced or not forced, depending on the definition of this parameter in the Assignable causes list page.
Corrective actions: it is possible to:
List:
select a corrective actions list: tap the Search icon (
) and then select an already configured item in the Corrective actions list page.add a new corrective actions list: tap the Search icon (
); on the upper-right corner of the Corrective actions list page, tap Add to configure a new item.delete the link to the corrective actions list: tap the Delete icon (
).
Mandatory: if the check box is selected, the operator must select/type a corrective action to continue the test.
Force selection from list: select between:
No: the operator can type the corrective action, without selecting it from the list.
Yes: the operator can only select the corrective action from the list.
Inherit: the selection from list can be forced or not forced, depending on the definition of this parameter in the Corrective actions list page.
In the Add Cm/Cmk inspection page, tap Save.
To delete a step:
This function is available from Step 2. It is not possible to delete Step 1.
In the Step category of the Add Cm/Cmk inspection page, select the step to delete.
In the Step section, tap the Delete icon (
 ) to delete the step.
To change the order of the steps:
In the Step category of the Add Cm/Cmk inspection page, select the step to move.
On the lower pat of the Step section, tap the backward/forward arrow to change the order of the steps.
Cm/Cmk multistep parameters
General category
Name: type the name of the inspection. The maximum number of characters permitted is equal to 50.
Barcode identifier: it identifies the inspection. If left blank, the identifier corresponds to the inspection name.
Strategy: select the tool strategy Multistep.
Number of samples: type the number of results to do.
The maximum number of samples is 99.
Cm Cmk minimum sample number: type the minimum number of samples to display the result status. The default value is set in the Inspection default values page.
Measurement device type: STbench is the only measuring device type available for this test strategy.
Measurement device S/N: type the serial number of the measuring device connected to the device.
STbench channel: select the STbench channel to use to do the test. The available options are:
Manual selection.
Number of the STbench channel (from 1 to 8).
The test must be performed on an external transducer, not on the STbench brakes
Transducer S/N: type the serial number of the transducer linked to the measuring device connected to the device.
Filter frequency: type the value of the filter frequency. The allowed range is from 100 to 2000 Hz. The default value is 500 Hz.
Tightening direction: from the drop down list select the tightening direction. The available items are Clockwise and Counterclockwise.
Minimum Cm Torque: type the minimum value of the Cm index for the torque.
Minimum Cm Torque ranges from 0 to 9999.
Minimum Cmk Torque: type the minimum value of the Cmk index for the torque.
Minimum Cmk Torque ranges from 0 to 9999.
Minimum Cm Angle: type the minimum value of the Cm index for the angle.
Minimum Cm Angle ranges from 0 to 9999.
Minimum Cmk Angle: type the minimum value of the Cmk index for the angle.
Minimum Cmk Angle ranges from 0 to 9999.
Measure delay time: type the value of the measure delay time.
The measure delay time ranges from 0.0 s to 5.0 s.
Cycle start: the default value is managed by the measuring device and it is indicated as Automatic value. It is possible to type the cycle start value.
It must be higher than the transducer Minimum load and equal/lower than the Final angle monitoring torque.
If the Cycle start is set to zero, the device gives automatically a Cycle Start equal to the transducer Minimum load.
Final angle monitoring torque: type the final angle monitoring torque value.
Unit of measurement: select the unit of measurement to use.
Steps category
Step type: select one of the available options:
Tightening.
Loosening.
Check type: select one of the available options:
Torque.
Angle.
Control mode: select how to define the limits of the selected variable (torque or angle). The options are: Min/Max and Target/tolerance.
Minimum torque/angle: type the minimum value of the torque/angle. This parameter is available if Control mode is set to Min/Max.
Maximum torque/angle: type the maximum value of the torque/ angle. This parameter is available if Control mode is set to Min/Max.
Target torque/angle: type the value of the target torque/angle. This parameter is available if Control mode is set to Target/Tolerance.
Torque/angle tolerance: type the value of the tolerance of the torque/angle. This parameter is available if Control mode is set to Target/Tolerance.
End cycle time: type the value of the end cycle time.
The “quick programming” test stops when the torque continues to be applied but it is under the Cycle complete for a time longer than the End cycle time.
The end cycle time ranges from 0.1 s to 5.0 s.
Used for result: select the Used for result check box to use the specific step for the final result.
Measure torque at: select one of the available options:
Torque peak
Angle peak
CAM/Cpk CNOMO multistep parameters
General category
Name: type the name of the inspection.
Barcode identifier: it identifies the inspection. If left blank, the identifier corresponds to the inspection name.
Strategy: select the tool strategy “Multistep”.
Number of samples: type the number of results to do.
The maximum number of samples is 99.
Measurement device type: STbench is the only measuring device available for this test strategy.
Measurement device S/N: type the serial number of the measuring device connected to the device.
STbench channel: select the STbench channel to use to do the test. The available options are:
Manual selection.
Number of the STbench channel (from 1 to 8).
The test must be performed on an external transducer, not on the STbench brakes
Transducer S/N: type the serial number of the transducer linked to the measuring device connected to the device.
Filter frequency: type the value of the filter frequency. The allowed range is from 100 to 2000 Hz. The default value is 500 Hz.
Tightening direction: from the drop down list select the tightening direction. The available items are Clockwise and Counterclockwise.
Minimum CAM Torque: type the minimum value of the CAM index for the torque.
Minimum CAM Torque ranges from 0 to 9999.
Minimum Cpk Torque: type the minimum value of the Cpk index for the torque.
Minimum Cpk Torque ranges from 0 to 9999.
Minimum CAM angle: type the minimum value of the CAM index for the angle.
Minimum CAM Angle ranges from 0 to 9999.
Minimum Cpk angle: type the minimum value of the Cpk index for the angle.
Minimum Cpk Angle ranges from 0 to 9999.
Measure delay time: type the value of the measure delay time.
During the measure delay time the torque trace is not analyzed and the click-point is not detected.
The measure delay time ranges from 0.0 s to 5.0 s.
Cycle start: the default value is managed by the measuring device and it is indicated as Automatic value. It is possible to type the cycle start value.
It must be higher than the transducer Minimum load and equal/lower than the Final angle monitoring torque.
If the cycle start is set to zero, the device gives automatically a Cycle Start equal to the transducer Minimum load.
Final angle monitoring torque: type the final angle monitoring torque value.
Unit of measurement: select the unit of measurement to use.
Steps category
Step type: select between the following:
Tightening.
Loosening.
Check type: select between the following:
Torque.
Angle.
Control mode: select how to define the limits of the selected variable (torque or angle). The options are: Min/Max and Target/tolerance.
Minimum angle/torque and Maximum angle/torque are automatically defined according to the Angle/Torque tolerance specified.
Minimum torque/angle: type the minimum value of the torque/angle. This parameter is available if Control mode is set to Min/Max.
Maximum torque/angle: type the maximum value of thetorque/ angle. This parameter is available if Control mode is set to Min/Max.
Target torque/angle: type the value of the target torque/angle. This parameter is available if the Target/Tolerance option of the Control mode is selected.
Torque/angle tolerance: type the value of the tolerance of the torque/angle. This parameter is available if Control mode is set to Target/Tolerance.
End cycle time: type the value of the end cycle time.
The “quick programming” test stops when the torque continues to be applied but it is under the Cycle complete for a time longer than the End cycle time.
The end cycle time ranges from 0.1 s to 5.0 s.
Used for result: select the Used for result check box for using the specific step for the final result.
Measure torque at: select one of the following options:
Torque peak
Angle peak
Adding a Tool check Inspection through the Template file
Generate the Template file for inspections on a USB storage device (for more information, see Generating Tool check / Joint check template).
Put the USB storage device into the USB port of the own PC.
From the PC, open the USB storage device.
Open the file STpad_ToolInspectionImportFile.xlsm. The following is displayed:

Complete the file STpad_ToolInspectionImportFile.xlsm to define the necessary inspection(s).
When all the mandatory fields are filled in, the Wrong field column becomes green.
The file STpad_ToolInspectionImportFile.xlsm defines not only inspection(s), but also the linked tool(s). These are automatically imported on the device through the file STpad_ToolInspectionImportFile.stpad.
Check the Excel option for the workbook calculation. Open a Excel file and click File > Options. On left side of the Excel options dialog box, select Formulas > Automatic option for the Calculation options section.
When the Wrong field column in correspondence of the new inspection(s) is green colored, click the blue button Sort and export to automatically generate the file STpad_ToolInspectionImportFile.stpad.
The file STpad_ToolInspectionImportFile.stpad is automatically saved into the USB storage device.
Only the STpad_ToolInspectionImportFile.stpad can be correctly imported on the device (for more information about how to import inspections, see “Import inspections”).
Save the file STpad_ToolInspectionImportFile.xlsm.
Close the file STpad_ToolInspectionImportFile.xlsm.
Close the USB storage device.
Remove the USB storage device from the USB port of the own PC.
Import the inspection(s) saved in the file STpad_ToolInspectionImportFile.stpad on the device (for more information about how to import routes, see Importing the inspection(s) on the device).
Click the Menu icon > Tools to check the import of the inspection(s) is correctly done.
Deleting Tool inspection
On the upper-right corner of the Inspections category of the Tool page, tap Select.
On the left side of the Inspections category, select the check box of the inspection(s) to delete.
On the upper-right corner of the Tools page, tap Delete.
On the Confirmation required message, tap OK.
Editing Tool inspection
In the Tools page, select a tool.
On the upper part of the Edit tool page, tap Inspections.
In the Inspections category, tap the name of the inspection to edit.
In the Edit inspection page, change the necessary parameters.
On the upper-right corner of the Edit inspection page, tap Save.
If the inspection is sent by an external software, it is not possible to edit it.
Running Tool inspection
In the Home page, tap Tool.
In the Tool page, tap Play to run the inspection.
In the Select transducer dialog box, select the transducer to be used during the Inspection.
Do the test.
During the test, the following page is updated in real time.The following screen is displayed only if the Measuring device is set to STbench.
In the event the STbench has not reached the optimal operating pressure, the message STbench is pressurizing the circuit is displayed. The pop-up message automatically closes when the correct pressure is reached and the test starts.

A
Inspection categories
B
Tuning brake button
C
Batch size counter
D
Command buttons
E
Test values
F
Brake status indicator
G
Test values summary
H
Variable chart
Results category
In the Results category of the Run inspection page, the following items are shown:
On the left side of the Results category, the variable chart shows a plot with all the results of the inspection.
By selecting a result from the variable chart, the relative value is highlighted in the result table on the right, and vice versa.On the right side of the Results category, the batch size counter (
 ) indicates the number of the results to do.
If the batch size is set to zero, only the progressive index of the results is displayed ( ).
).
If the batch size is greater than zero, the batch is displayed as "number of results done/total number of results to do" ().On the right side of the Result category, the Tuning brake button optimizes the braking. By selecting the Tuning brake button, the test is restarted.
On the right side of the Results category, the following command buttons are displayed:
To delete the whole set of results (when enabled by external software), tap the following icon:
 .
.
For SPC (tool) inspection, it is not possible to delete a result if the subgroup is completed.
For tests run on the Motorized static cell: in the event the test is stopped by opening the safety cage, when the cage is closed it is possible to delete all the results and automatically restart the test.To delete one result (when enabled by external software), select it and tap the following icon:
 .
.To add a comment to a result, select it and tap the following icon:
 .
.To add a picture to a result, select it and tap the following icon:
 .
.
On the right side of the Results category, the results table shows all the values acquired during the test.
If a result is NOK, the related value in the results table is highlighted with a red colored bar.
On the lower-right corner of the Result category, the brake status indicator shows that the measuring device is ready for the test (blue indicator
 ), or that the measuring device is not ready for the test (red indicator
  ).
).
If the indicator is red, wait until the indicator turns blue before acquiring the next value.In the lower part of the Result category, the following summary of the values acquired are shown:
Minimum: minimum value among the results of the inspection.
Maximum: maximum value among the results of the inspection.
STD (σ): Standard deviation (indicated with the Greek letter “Sigma”) of the results of the inspection. At the beginning the STD (σ) value is equal to 0 and changes after at least two results.
Average: average value of the results of the inspection.
Cm and Cmk values change after reaching the number of samples defined during the inspection definition. If the number of samples is equal to 0, Cm and Cmk values change after three results.
Summary category for Cm/Cmk and CAM/Cpk CNOMO
On the upper part of the Run inspection page, tap Summary to displayed the statistics parameters related to the measured torque/angle values.
The following parameters are shown:
Test results: result of the test (OK, NOK).
Minimum Cm (Minimum CAM): value of minimum Cm (CAM), configured in the inspection.
Cm (CAM): value of the Cm (CAM) index calculated, by using the measured values.
Minimum Cmk (Minimum Cpk): value of minimum Cmk (Cpk), configure in the inspection.
Cmk (Cpk): value of the Cmk (Cpk) index, calculated by using the measured values.
To restart the test: on the upper-right corner of the Summary category, tap Restart test.
To exit the test: on the upper-right corner of the Summary category, tap End test.
If the batch is completed, after the End test is tapped, the test is closed without showing any Confirmation message.
If the batch is not completed or the batch is set to zero, after the End test is tapped, a Confirmation massage is displayed.
To print the test report: on the upper-right corner of the Summary category, tap Print report.
To print the test label: on the upper-right corner of the Summary category of the Cm/Cmk inspection, tap Print label.
In the label, the following information are shown:
Barcode related to the Tool ID.
Tool ID
Nominal value of the test (torque, angle or both)
Location of the tool
Test date
Date of the next test
Cm/Cmk values. The values are negative if the test is NOK
Summary category for SPC
When the subgroup defined in the SPC configuration is completed, the Summary category opens.
If one or more rules are violated, the SPC rules check result opens, showing the status of the rules.
If no rule is violated, the SPC rules check result is not shown.
After the dialog box appears, tap the Summary category.
In the Summary page, the following information are shown:

A | Add button | B | Restart test button |
C | Statistic parameters | D | Enabled rules |
The Add button is shown only for the SPC dimensional
The shown statistic parameters are:
X: it is the average value of the results of the Inspection.
R: it is the range value according to ISO standard.
S: saved values related to the subgroup size defined in inspection configuration.
Below the statistic parameters, the enabled rules and their status are indicated.
If the rule is marked in:
green: the rule is passed.
red: the rule is failed.
grey: the number of values is not enough to calculate the rule.
If a rule is disabled, it is not shown in the list.
Refer to the paragraph SPC rules for the procedure to enable/disable the SPC rules.
To restart the test, tap Restart test. The statistics are reset, and in the Summary page the results of the last test are shown.
To exit the test: on the upper-right corner of the Summary category, tap End test.
If the batch is completed, after the End test is tapped, the test is closed without showing any Confirmation message.
If the batch is not completed or the batch is set to zero, after the End test is tapped, a Confirmation massage is displayed.
To print the test label: on the upper-right corner of the Summary category, tap Print label.
In the label, the following information are shown:
Barcode related to the Tool ID.
Tool ID
Nominal value of the test (torque, angle or both)
Location of the tool
Test date
Date of the next test
Summary for ISO 6789:2003
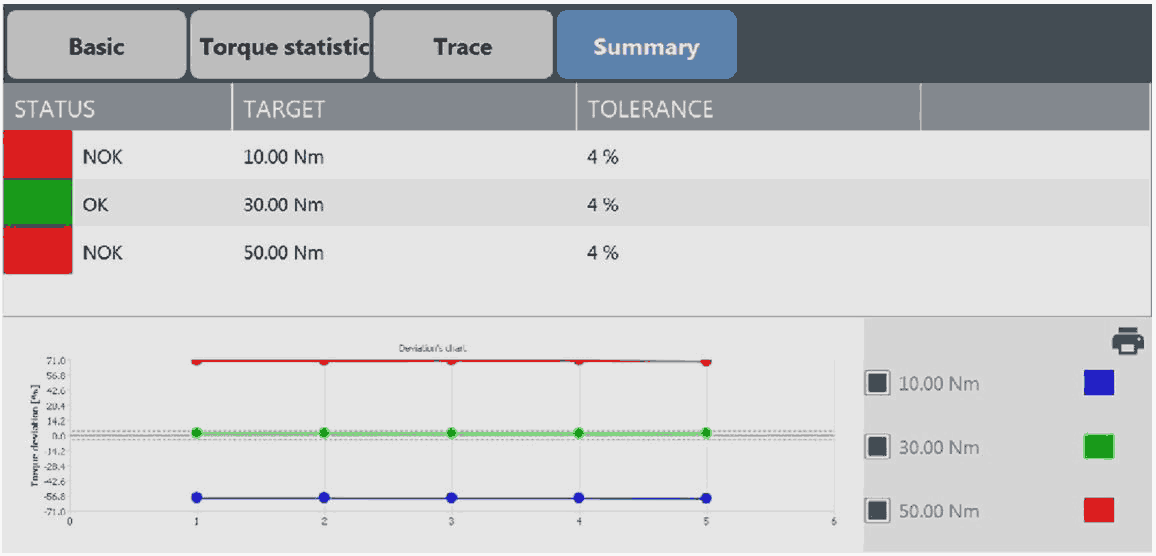
Overall Status: the upper area of the above summary view is the overall status of the inspection. If the label is green colored then all the deviations from the test results are within the tolerance, otherwise the label is red colored.
Deviation’s chart: the deviation’s chart shows the deviation values as points of colored curves; each of them represents the single phase of the inspection.
To print the test report: on the upper-right corner of the Summary category, tap Print report.
To print the test label: on the upper-right corner of the Summary category, tap Print label.
In the label, the following information are shown:
Tool ID
Location of the tool
Date of the next test
Test result (OK, NOK)
Summary for ISO 6789-2:2017

A | Add notes button | B | End test button |
C | Statistic parameters |
The table displays the results of each measurement sequence, the available parameters are:
Xa [Nm]: target indicated, set or nominal value depending on the type and class of the torque tool.
Xr [Nm]: mean reference value determined by the measurement device.
as [%]: calculated relative measurement error of the torque tool for the calibration torque.
W: relative expanded measurement uncertainty of the torque tool at the calibration torque.
W': relative measurement uncertainty interval of the torque tool at the calibration torque.
Tap the Add notes button to add comments to the inspection.
Tap the End test button to exit the result summary and end the test.
To print the test report: on the upper-right corner of the Summary category, tap Print report.
Summary for ISO 5393

A | Upper/Lower test torque level | B | Hard/Soft combined statistics values |
Upper/Lower test torque level: the Upper/Lower test torque level defines the main statistics values coming from the ISO 5393 Inspection execution.
Mean torque: mean value according to ISO norm.
Range: range value according to ISO norm.
Standard deviation: measure of the dispersion based on the mean-squared deviation, according to ISO norm.
6σ torque scatter: predictable range of torque over which a tool runs through a single torque-rate joint under controlled conditions, according to ISO norm.
6σ scatter % of mean torque: single numerical value designating the torque capability of a tool run on a single torque-rate joint under controlled conditions, according to ISO norm.
Hard/Soft combined statistics values: the Hard/Soft combined statistics values define the combination of the statistic values coming from the execution of the Hard and Soft sessions of ISO 5393 Inspection.
Combined mean torque: midpoint of the combined torque scatter of a tool between the lowest and the highest predictable torque readings, according to ISO norm.
Mean shift: difference in mean torque of a tool run on a threaded joints of two different torque rates at the same setting of the tool torque adjustment, according to ISO norm.
Combined torque scatter: the total probable range of torque of a tool run on all joints used in practice at the same setting of the tool torque adjustment, according to ISO norm.
Combined torque scatter % of combined mean torque: single numerical value designating the torque capability of a tool run on joints of varying torque rate, according to ISO norm.
To print the test report: on the upper-right corner of the Summary category, tap Print report.
Summary for VDI/VDE 2465-2
At the end of the VDI/VDE 2465-2 test, the Summary category opens.
In the Summary category, tap Evaluate. Then the Data analysis - Test point opens.
In theTest for outliers page, the chart of the measured value is displayed. In the chart the following parameters are shown:
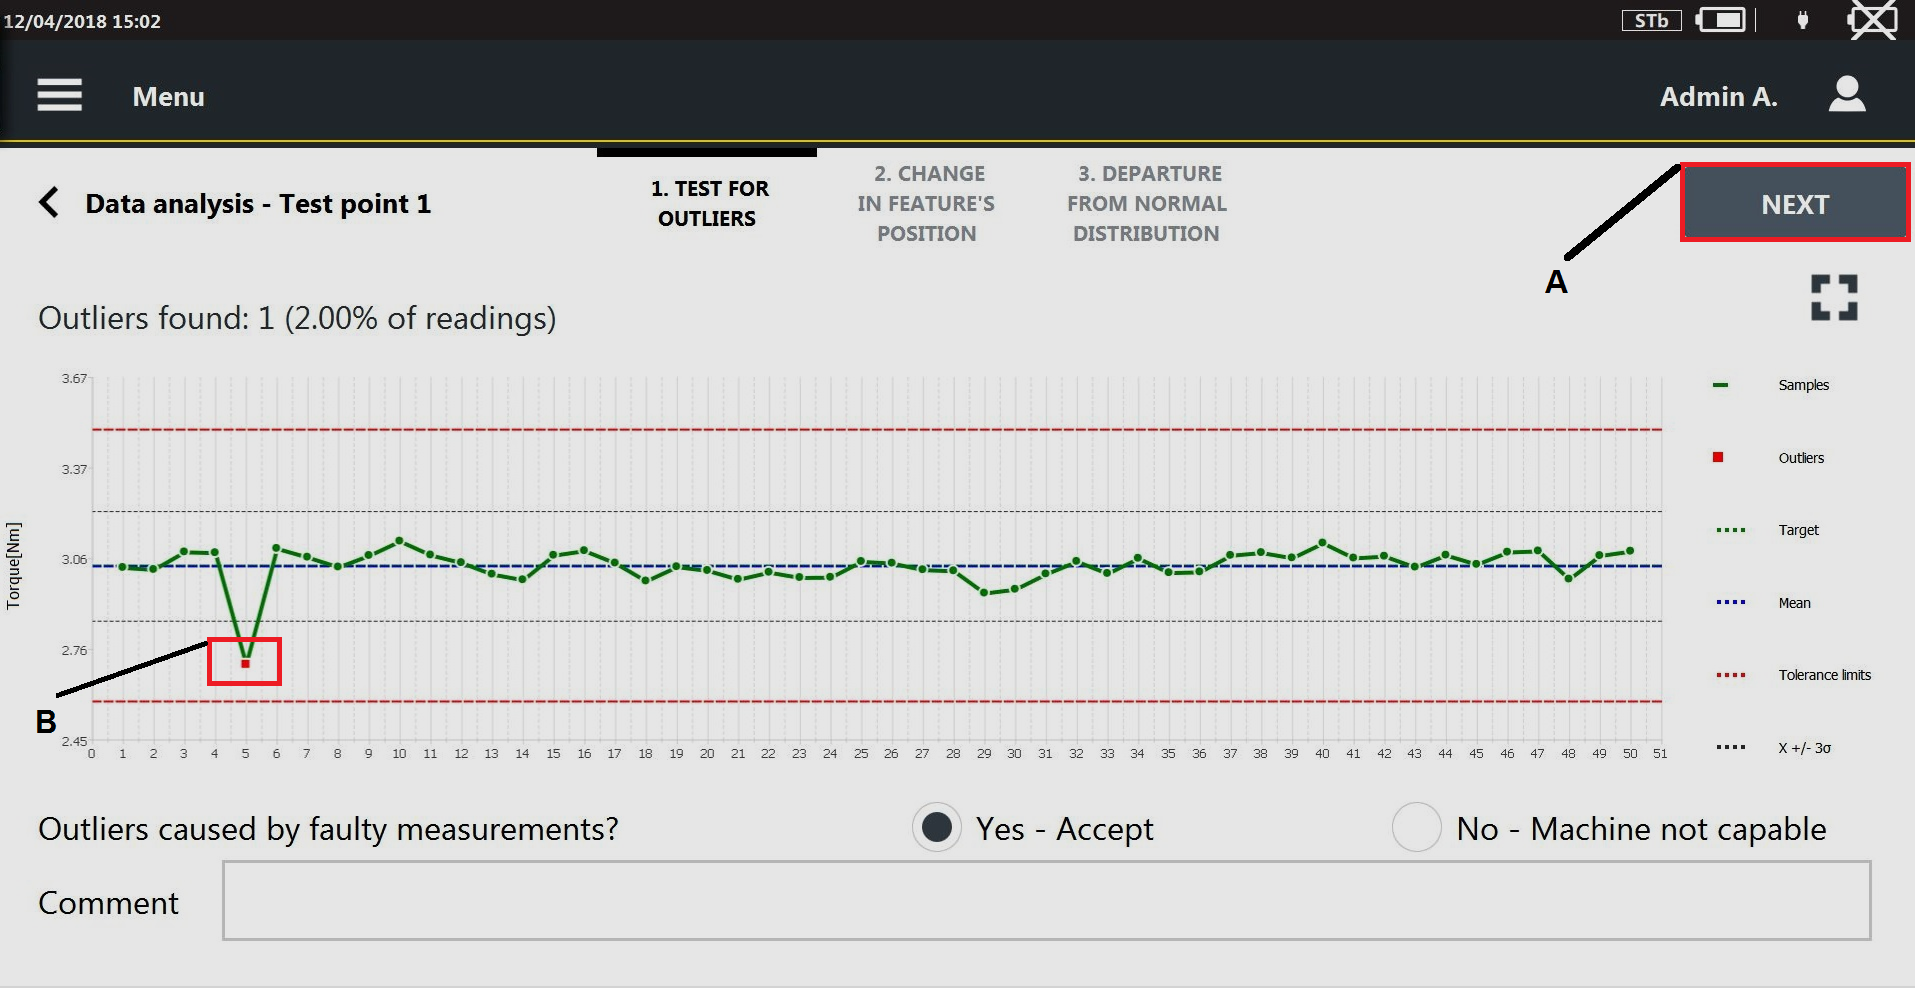
A
Next
2
Outlier
Target value
Mean value
Tolerance limit
Control limit (x ± 3σ)
If an outlier is detected, it is highlighted with a red point.
Under the chart, the following question is displayed: Outliers caused by faulty measurements?
Select Yes, if the outlier are not caused by a faulty measurements.
Select No, if the outlier is caused by a faulty measurements.
In Comment text box, it is possible to type a comment.
On the upper-right corner of the Data analysis page, tap Next.
In the Change in feature's position page, Changes detected indicates if the measured values are randomly distributed (Changes detected = No) or not (Changes detected = Yes).

A
Next
If the Change detected = Yes, the following question is displayed: Cause known and effect acceptable?
Select the Yes, if the cause of the not normality of the distribution is known.
Select the No, if the cause of the non-normality of the distribution is unknown.
In Comment text box, it is possible to type a comment.
On the upper-right corner of the Data analysis page, tap Next.
In the Departure from normal distribution page, the graph shows the histogram of the measure values and the fitting distribution. The parameter Normal distribution indicates if the measured values are distributed or not as a normal distribution.
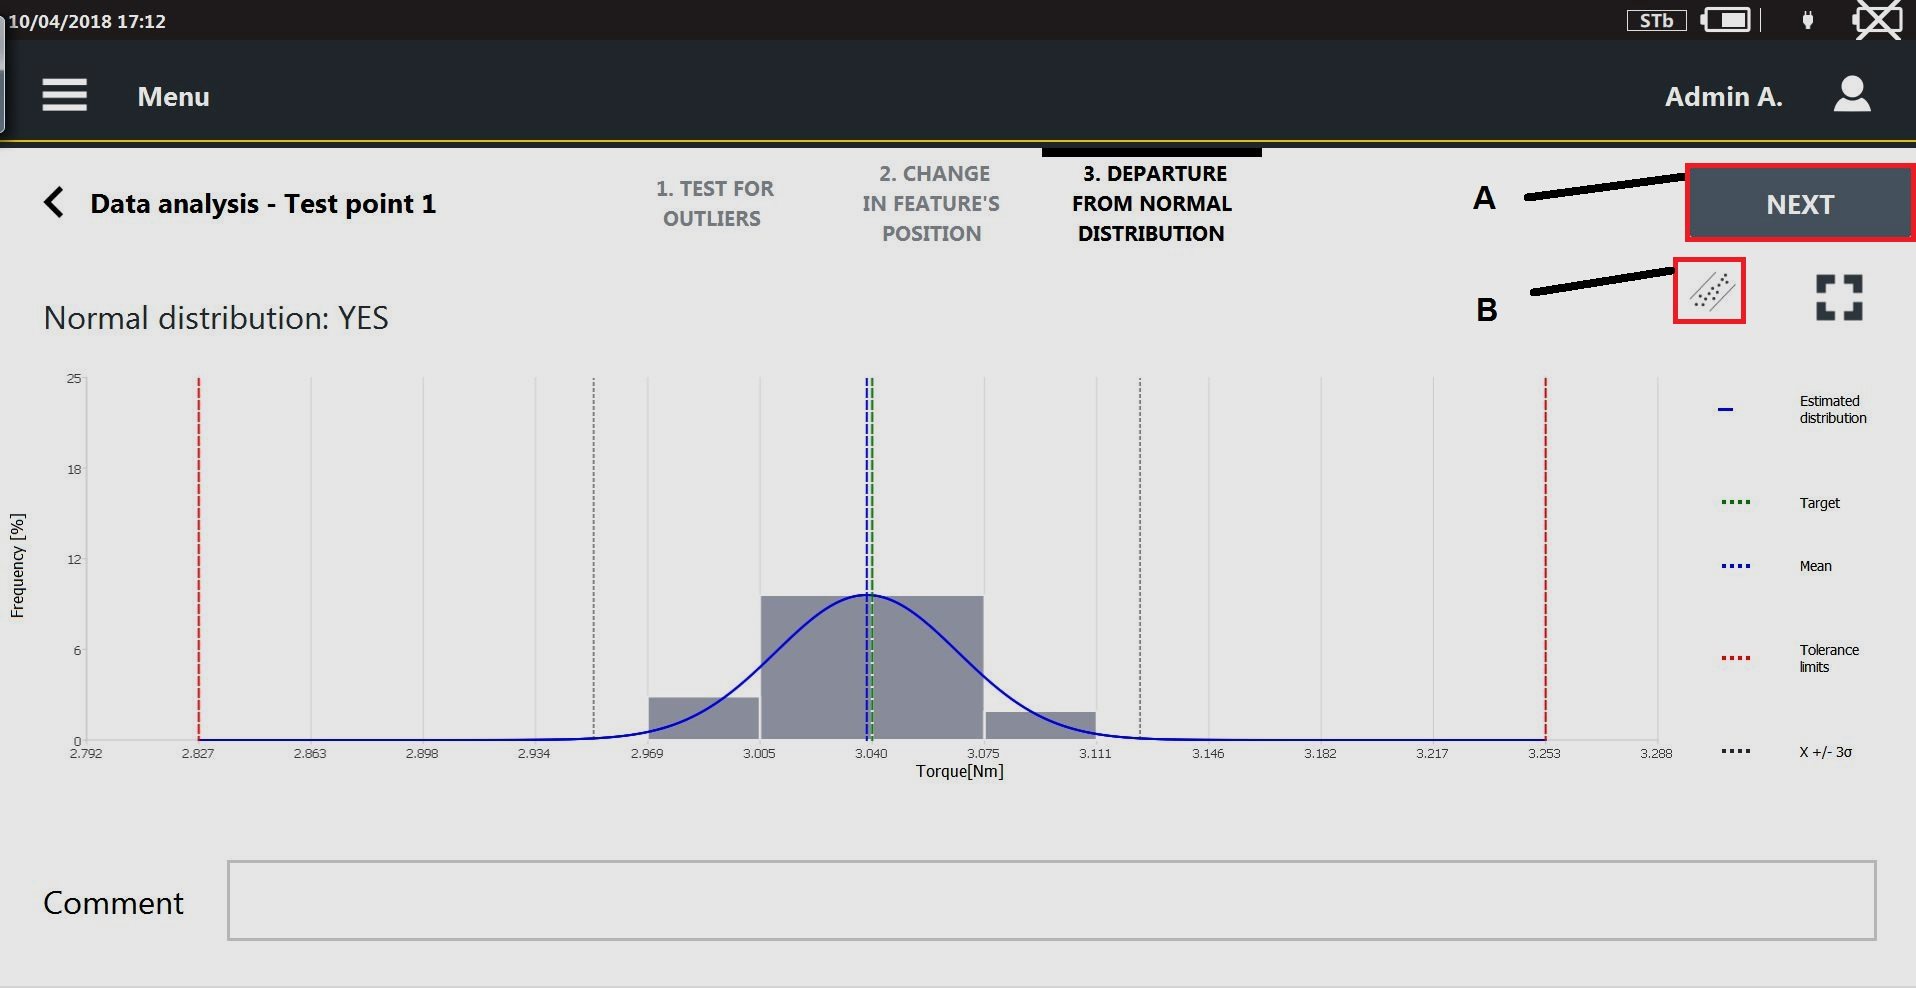
A
Next
B
Probability plot icon
If Normal distribution = Yes:
the fitting distribution is shown.
the mean value and the limits x± 3σ are shown.
If Normal distribution = No:
the fitting distribution is not shown.
the Xo/Xu and the median (X50%) values are displayed.
the following question is displayed: Cause known and effect acceptable?
Select the Yes, if the cause of the not normality of the distribution is known.
Select the No, if the cause of the not normality of the distribution is unknown.
In Comment text box, it is possible to type a comment.
On the upper-right corner of the Departure from normal distribution page, tap the Probability plot icon.
The Probability plot chart opens. The parameter Normal distribution indicates if the measured values are distributed or not as a normal distribution.

A
Next
On the upper-right corner of the Departure from normal distribution page, tap Next. Then tap Start to run the next test point.
Start is available only if the test result of the last test point done is OK.
To print the label at the end of the test: on the upper-right corner of the Summary category, tap Print label.
In the label, the following information are shown:
Tool ID
VDI 2645-2 standard applied
Location of the tool
Date of the last check
Date of the next check
Test result (OK/NOK)
Summary for JJF 1610:2017

A | Add notes button | B | End test button |
C | Statistic parameters |
The table displays the results of each calibration point of high torque rate reading and low torque rate reading. The available parameters are:
Target [Nm]: target value of each calibration point of high torque rate and low torque rate.
X [Nm]: mean value of the acquired measurements of high torque rate and low torque rate.
Relative tolerance [%]: relative tolerance of high torque rate reading (δH) and low torque rate reading (δL).
Repeatability [%]: repeatability of high torque rate reading (RH) and low torque rate reading (RL).
U [%]: expanded uncertainty.
To print the test report: on the upper-right corner of the Summary category, tap Print report.
Torque/angle statistic category
In the upper part of the Run inspection page, tap Torque/Angle statistics to displayed the statistics parameters related to the measured torque/angle values.
The following parameters are shown:
Samples: it is the number of acquired results.
Minimum: it is the minimum value between the results of the Inspection.
Maximum: it is the maximum value between the results of the Inspection.
Range: it is the range value according to ISO norm.
Average: it is the average value of the results of the Inspection.
STD (σ): it is the standard deviation (indicated with the Greek letter “Sigma”) of the results of the Inspection.
3σ/X: it is the value of the “3 sigma percentage” parameter (3 times the standard deviation) over the average value according to ISO norm.
X-3σ: it is the value of the “mean minus 3 times the standard deviation (sigma)” parameter according to ISO norm.
X+3σ: it is the value of the “mean plus 3 times the standard deviation (sigma)” parameter according to ISO norm.
Cm: it is the Cm value according to ISO norm.
Cmk: it is the Cmk value according to ISO norm.
CAM: it is the CAM value according to CNOMO norm.
Cpk: it is the Cpk value according to CNOMO norm.
CNOMO Mean range: it is the mean range value according to CNOMO norm.
CNOMO Istantaneous STD (σ): it is the istantaneous deviation (indicated with the Greek letter “Sigma”) of the results of the Inspection according to CNOMO norm.
CNOMO STD (σ): it is the standard deviation (indicated with the Greek letter “Sigma”) of the results of the Inspection according to CNOMO norm.
OK: it is the percentage value of the results between minimum and maximum limit.
Low: it is the percentage value of the results under the minimum limit.
High: it is the percentage value of the results over the maximum limit.
After every new result, all the “Torque statistic” parameters are updated accordingly.
Trace category
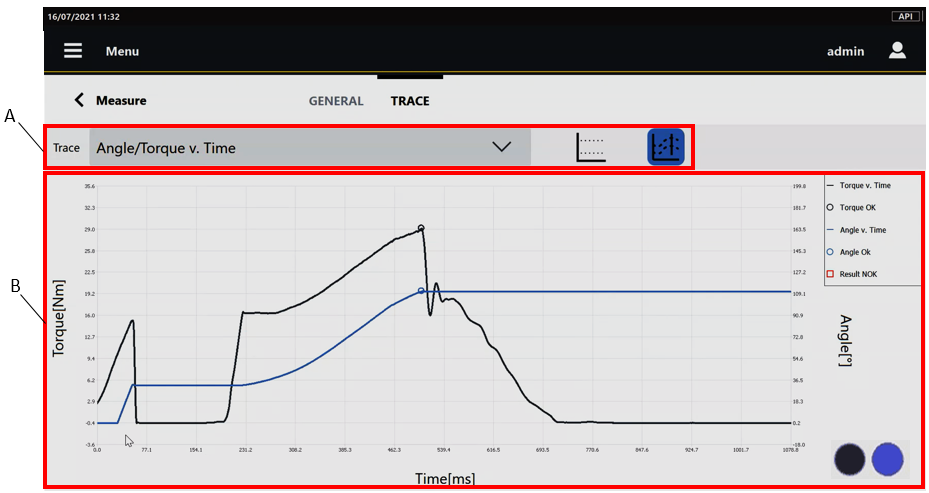
A | Trace toolbar | B | Trace with legend |
The Trace toolbar provides the following functionality:
Trace: select from the Trace drop-down box the plot to be displayed:
Torque v. time: torque-time plot of the last result.
Angle v. time: angle-time plot of the last result.
Angle/Torque v. Time: angle/torque-time plot are shown at the same time. A double vertical axis is shown on the chart.
Torque v. Angle: torque-angle plot of the last result.
Angle v. time, Angle/Torque v. Time and Torque v. Angle are available only in the following conditions:
The test runs on a brake.
The test runs on a transducer with angle measurement.
Limits: select the Limits button (
 ) to display the tolerance limits on the chart.
The graph shows the last result. After every new result, the trace shown is updated accordingly.
Angle trace from Cycle start: select the Angle trace from Cycle start button (
 ) to display the angle trace from the start of the test.
On the lower-right corner of the Trace category, the brake status indicator shows that the measuring device is ready for the test (blue indicator
), or that the measuring device is not ready for the test (red indicator ).
If the indicator is red, wait until the indicator turns blue before acquiring the next value.
If the Double result function is enabled on the STwrench and on the device, both the residual point and the peak point are shown on the plot.
Calibrating Power Focus
Connect the system (for more information, see STbench Operation Manual / STpad Operation Manual – Operation – Calibrating Power Focus - General Information).
Switch on both the device and the Power Focus. On the Power Focus, select the necessary Pset according to customer needs.
For Power Focus 6000, it is necessary to enable the QA Calibration in the Tool section and select the virtual station linked to the tightening program to use for the calibration.
For more information about how to select a Pset/Tightening program on the Power Focus, see Power Focus Manual.
On the device, configure the Power Focus (for more information, see Controllers).
After configuring the Power Focus, configure the tool to calibrate (for more information, see Adding a Tool).
After configuring the tool to calibrate, configure the calibration inspection (for more information, see Adding a Calibration inspection).
At the end of the configuration of the calibration inspection, the following is displayed:

A
Play
Tap Play for running the Inspection.
If in the Controller category of the calibration inspection, Manual selection is selected, a synchronization mode dialog box appears during the calibration. Select the synchronization mode to continue the calibration process.
At the end of the calibration inspection, the following is displayed:

A
Calibration inspection Toolbar
On the Calibration inspection Toolbar, the Results page shows a plot with all the results of the inspection (on the right side), and the list of the results of the inspection (on the left side).
On the Calibration inspection Toolbar, tap Summary to display the following page:
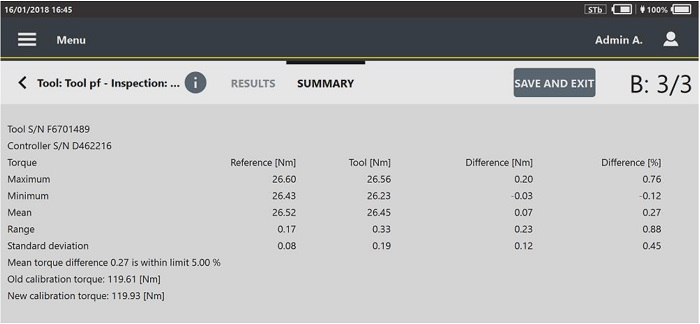
Tap Save and Exit, then tap Yes in the dialog box that opens to save the new calibration value on the tool calibrated.
If during the calibration process the internet connection is unstable, a dialog box is displayed. Then, it is possible to insert the controller result manually.
If a label printer is configured, a dialog box asking to confirm the printing of the label is displayed.
Calibrating PowerMACS
Connect the system (for more information, see STbench Operation Manual / STpad Operation Manual – Operation – Calibrating PowerMACS - General Information).
Switch on both the device and the PowerMACS.
On the device, configure the PowerMACS (for more information, see Controllers).
After configuring the PowerMACS, configure the tool to calibrate (for more information, see Adding a Tool).
After configuring the tool to calibrate, configure the calibration inspection (for more information, see Adding a calibration inspection).
At the end of the configuration of the calibration inspection, the following is displayed:
A
Play
Tap Play for running the Inspection.
If in the Controller category of the calibration inspection, Manual selection is selected, a synchronization mode dialog box appears during the calibration. Select the synchronization mode to continue the calibration process.
At the end of the calibration inspection, the following is displayed:

A
Calibration inspection Toolbar
On the Calibration inspection Toolbar, the Results page shows a Torque chart with all the results of the inspection (on the right side), and the list of the results of the inspection (on the left side).
Tap the Angle icon (
 ) placed on the upper right corner of the Torque chart to show the Angle chart:
On the Calibration inspection Toolbar, tap Summary to display the following page:

Tap Save and Exit, to save the new scale factor on the tool calibrated.
If a label printer is configured, a dialog box asking to confirm the printing of the label is displayed.
Calibrating generic controllers
Connect the system (for more information, see STbench Operation Manual / STpad Operation Manual – Operation - Calibrating generic controllers - General Information).
Switch on both the device and the generic controller.
On the device, configure the generic controller (for more information, see Controllers).
After configuring the generic controller, configure the tool to calibrate (for more information, see Adding a Tool).
After configuring the tool to calibrate, configure the calibration inspection (for more information, see Adding a Tool inspection).
At the end of the configuration of the calibration inspection, the following is displayed:
A
Play
Tap Play to run the inspection.
At the end of the calibration inspection, the following is displayed:
A
Calibration inspection Toolbar
On the Calibration inspection Toolbar, the Results page shows a plot with all the results of the inspection (on the right side), and the list of the results of the inspection (on the left side).
On the Calibration inspection Toolbar, tap Summary to display the following page:
Tap Save and Exit, then save the new calibration value on the tool calibrated.
If during the calibration process the internet connection is unstable, a dialog box is displayed and it is possible to insert the controller result manually.
At the end of the calibration procedure, a dialog box is displayed. Tap Report to create a copy of the calibration report on an external device (i.e. USB storage device), or tap Close to exit.
The calibration report can be generated also from the Results. For more information see "Viewing the details of the inspection result".
If a label printer is configured, a dialog box asking to confirm the printing of the label is displayed.
Joints
The set of parameters that controls a test process is within a joint. This section describes how to setup the joint parameters necessary to do a test.
The device can store up to 10000 joints into its own memory.
In the Home page, select Joints. The following is displayed:

A | Search button | B | Barcode button |
C | Command button | D | Play button |
E | List of Joints |
Below are the columns that define the list of Joints:
Name: it is assigned when the Joint is created. For more information about how to edit the Joint name, see “Editing a Joint".
Range torque: it is assigned when the Joint is created. For more information about how to edit the range torque, see "Editing a Joint”.
Range angle: it is assigned when the Joint is created. For more information about how to edit the range angle, see "Editing a Joint”.
To sort the columns that define the list of Joints: tap the column to be sorted, the up arrow (placed on the right of the column heading) lists the Joint Name (or Range Torque / Range angle) details in ascending alphabetical order; the down arrow lists the Joint Name (or Range Torque / Range angle) details in descending alphabetical order.
To customize the sequence of the columns that defines the list of Joints: tap the column heading to be moved (Name / Range torque / Range angle), then drag and drop it to the necessary position.
When enabled by external software, the Barcode button () allows to scan a barcode to search the corresponding Joint inspection(s) on the measuring device. If the search finds a single Joint inspection, it is automatically run; if the search finds multiple Joint inspections with the same barcode identifier, run the inspection of interest from the list.
The Play button gets active only after adding/updating the inspection(s) linked to the Joint. If enabled, tap Play to run the test.
Adding a Joint
In the Home page, tap Joints.
On the upper-right corner of the Joint page, tap Add. The following is displayed:

A
Categories
B
Save button
C
Parameters
In General category of the Add joint page, configure joint general parameters.
In the Add joint page, tap Torque.
In the Torque category, configure the joint torque parameters:
In the Add joint page, tap Angle.
In the Angle category, configure the joint angle parameters:
On the upper-right corner of the Add joint page, tap Save.
Joint parameters
General category
Name (*): type the Joint name. The maximum number of characters permitted is equal to 50.
Description: type the Joint description. The maximum number of characters permitted is equal to 50.
Identifier: type the Joint identifier. The maximum number of characters permitted is equal to 50.
Tightening direction: select the tightening direction. The available items are Clockwise and Counterclockwise.
Trace simulation: it is possible to:
select a trace to be linked to the joint: tap the Search icon (
), then select an already configured trace from the Trace page.add a new trace to be linked to joint: tap the Search icon (
). On the upper-right corner of the Trace page, tap Add to configure a new trace.delete the link to the trace: tap the Delete icon (
).
If the test on the Joint is run on an STbench brake enabled for trace simulation, the bench will simulate the joint characteristics.
Notes: type the optional Joint notes.
Torque category
Unit of measurement: select the unit of measurement to use.
Final angle monitoring torque: type the final angle monitoring torque value.
The final angle monitoring torque must be equal or higher than the Minimum torque.
By default the value is the 50% of the Target torque.
Control mode: select how to define the torque limits. The options are: Min/Max and Target/tolerance.
Minimum torque (*): type the minimum value of the torque. This parameter is available if Control mode is set to Min/Max.
Target torque (*): type the value of the target torque.
Maximum torque (*): type the maximum value of the torque. This parameter is available if Control mode is set to Min/Max.
Torque tolerance (*): type the value of the tolerance of the torque. This parameter is available if Control mode is set to Target/Tolerance.
Angle category
Control mode: select how to define the angle limits. The options are: Min/Max and Target/tolerance.
Minimum angle (*): type the minimum value of the angle. This parameter is available if Control mode is set to Min/Max.
Target angle (*): type the value of target angle.
Maximum angle (*): type the maximum value of the angle. This parameter is available if Control mode is set to Min/Max..
Angle tolerance (*): type the value of the tolerance of the angle. This parameter is available if Control mode is set to Target/Tolerance.
Items marked with an asterisk (*) are required.
Deleting a Joint
In the Home page, tap Joints.
On the upper-right corner of the Joints page, tap Select.
On the left side of the Joints page, select the check box of the joint(s) to delete.
On the upper-right corner of the Joints page, tap Delete.
On the Confirmation required message, tap OK.
Editing a Joint
From the Joint page, tap an existing Joint that needs to be modified.
The following is displayed:
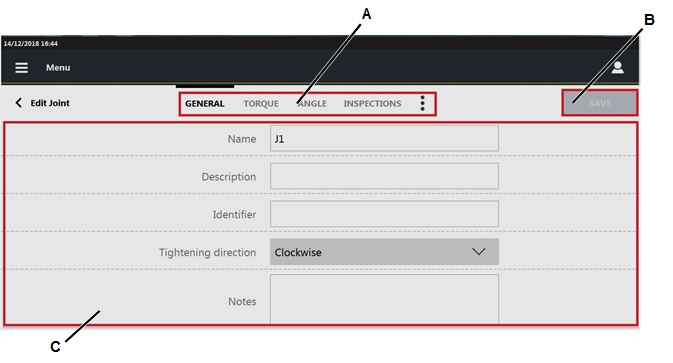
A
Categories
B
Save button
C
Parameters
In the Edit joint page, edit the necessary parameter(s) according to customer needs.
In the Inspection category, it is possible to configure the inspection(s) to perform on the joint. For more information about how to update the Inspections category, see the paragraph Joint inspections.
Tap the More option icon (
) > Linked inspection to open the list of the tool inspection linked to the joint On the upper-right corner of the Edit joint page, tap Save.
Searching a Joint
In the Home page, tap Joints.
In the central part of the toolbar, tap the Search icon (
).In the Search text box, type the string to search.
Partial matching is supported: joints whose name, identifier, torque range or angle range match the text string are shown.
To delete the typed string, tap the Reset icon ().
To exit the search function, tap the Left arrow icon ().
Joint inspections
The available inspection types for the joints are:
Cp/Cpk ISO
SPC (joint)
It is possible to save two inspection with the same name and the same target objet.
A warning message is displayed to advise the operator an inspection with the same name already exists.
Select Yes to save the inspection.
Select No not to save the inspection.
Adding a Joint inspection
In the Joints page, select a Joint already configured.
On the upper part of the Edit joint page, tap Inspections.
On the upper-right corner of the Inspections page, tap Add.
In the Test type window, select an inspection. In the following an example of the Add Cp/Cpk inspection page. The structure is the same for all the inspections.
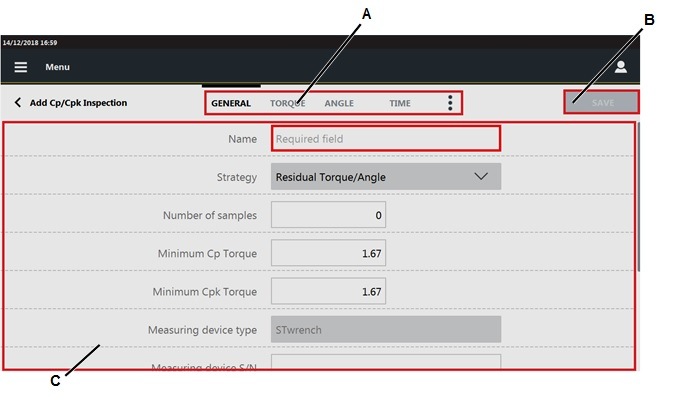
A
Categories
B
Save button
C
Parameters
In the General category, configure the general parameters of the inspection.
In the upper part of the Add inspection, tap Torque.
In Torque category, configure the torque parameters of the inspection
In the upper part of the Add inspection, tap Angle.
In Angle category, configure the angle parameters of the inspection.
In the upper part of the Add inspection, tap Time.
In Time category, configure the time parameters of the inspection.
On the upper part of the Add inspection, tap the More options icon (
). Then tap Picture. In this page the picture sent by external software is shown.In the Picture category, it is possible to:
Add an image/video: on a USB storage device, save the image/video to use in a folder named media_items, connect the storage device to the STpad and tap the Add button on the right side of the Picture page. In the Add picture dialog box, select the image/video to load and click OK.
The maximum size of images is 5 MB, the maximum size of videos is 10 MB.
Remove a picture: on the right side of the Picture page, tap the Remove button.
On the upper part of the Add inspection, tap the More options icon (
). Then tap Traceability.In the Traceability category of the Add inspection page, configure the following parameters:
Verification code: type the verification code that must be entered or scanned when the inspection is run. This field is case-sensitive.
Verification code description: to guide the operator, type the description of the verification code dialog box that is displayed when the inspection is run.
Assignable causes: it is possible to:
List:
select an assignable causes list: tap the Search icon (
) and then select an already configured item in the Assignable causes list page.add a new assignable causes list: tap the Search icon (
); on the upper-right corner of the Assignable causes list page, tap Add to configure a new item.delete the link to the assignable causes list: tap the Delete icon (
).
Mandatory: if the check box is selected, the operator must select/type an assignable cause to continue the test.
Force selection from list: select between:
No: the operator can type the assignable cause, without selecting it from the list.
Yes: the operator can only select the assignable cause from the list.
Inherit: the selection from list can be forced or not forced, depending on the definition of this parameter in the Assignable causes list page.
Corrective actions: it is possible to:
List:
select a corrective actions list: tap the Search icon (
) and then select an already configured item in the Corrective actions list page.add a new corrective actions list: tap the Search icon (
); on the upper-right corner of the Corrective actions list page, tap Add to configure a new item.delete the link to the corrective actions list: tap the Delete icon (
).
Mandatory: if the check box is selected, the operator must select/type a corrective action to continue the test.
Force selection from list: select between:
No: the operator can type the corrective action, without selecting it from the list.
Yes: the operator can only select the corrective action from the list.
Inherit: the selection from list can be forced or not forced, depending on the definition of this parameter in the Corrective actions list page.
In the upper-right corner of the Add inspection, tap Save.
Cp/Cpk ISO parameters
General category
Name: type the name of the inspection.
Barcode identifier: it identifies the inspection. If left blank, the identifier corresponds to the inspection name.
Strategy: select one of the following items:
Residual Torque/Angle.
Residual Torque/Peak.
Number of samples: type the number of results to do during the test. The maximum number of samples is 99.
Minimum Cp torque: the Cp index describes process capability; it is the number of times the spread of the process fits into the tolerance width. The higher the value of Cp, the better the process.
Minimum Cp Torque ranges from 0.00 to 9999.99.
Minimum Cpk torque: the Cpk index describes the capability corrected for position of the process capability in relation to the tolerance limits.
Minimum Cpk Torque ranges from 0.00 to 9999.99.
Measurement device type: the only measuring device available is STwrench.
Measurement device S/N: type the serial number of the measuring device.
Transducer S/N: type the serial number of the transducer, if used during the test.
Tightening direction: select the tightening direction. The available items are Clockwise and Counterclockwise.
Torque correction coefficient: type the torque correction coefficient. The value ranges from 0.10 to 99.99.
Angle correction coefficient: type the angle correction coefficient. The values ranges from 0 to 6553.
Torque category
Cycle start: the cycle start is the starting point of the test. It must be lower or equal of the Final angle monitoring torque.
If cycle start is set to zero or not defined, the STwrench automatically sets the value to the Mean load.
Final angle monitoring torque: the final angle monitoring torque specifies the torque value from which the angle measurement starts.
The final angle monitoring torque must be lower or equal to the Minimum torque.
If final angle monitoring torque is set to zero or not defined, the STwrench automatically sets the value to Cycle start.
Control mode: the control mode selects the condition to control the torque. It is possible to select either Min/Max or Target/Tolerance.
Minimum torque: minimum value of the torque. By default is the minimum torque defined in the joint configuration.
It is possible to change the default value typing a new value. This parameter is the available if Control mode is set to Min/Max.
Target torque: value of the target torque. By default is the target torque defined in the joint configuration.
It is possible to change the default value typing a new value.
Maximum torque: maximum value of the torque. By default is the minimum torque defined in the joint configuration.
It is possible to change the default value typing a new value. This parameter is the available if Control mode is set to Min/Max
Torque tolerance: the torque tolerance defines the maximum torque and the minimum torque according to the target torque specified. It is expressed in percentage. This parameter is the available if Control mode is set to Target/Tolerance
Change screw: type the change screw value. The value must be equal or higher than the Maximum torque.
Unit of measurement: unit of measurement set in the joint configuration.
Angle category
Residual angle threshold: type the value of the residual angle threshold. The value ranges from 1 to 45.
This parameter is available if Strategy is set to Residual torque/angle.
Breakaway angle threshold: type the value of the breakaway angle threshold. The value ranges from 1 to 20.
This parameter is available if Strategy is set to Residual torque/angle.
Target angle: type the value of the target angle.
This parameter is available if Strategy is set to Residual torque/peak.
Time category
Ratchet time: type the value in seconds of the ratchet time. The value ranges from 0.1 s to 30.0 s
SPC (joint) parameters
General category
Name: type the name of the inspection.
Barcode identifier: it identifies the inspection. If left blank, the identifier corresponds to the inspection name.
Strategy: select one of the following items:
Residual Torque/Angle.
Residual Torque/Peak.
Number of samples: type the number of results to do during the test. The maximum number of samples is 99.
Subgroup size: the subgroup size applies to a variable characteristic and controls how many samples (also called data values or readings) make up a single plotted point on a chart (called a subgroup). The subgroup size ranges from 1 to 25.
Subgroup frequency: type the frequency of the averages displayed in the X chart and in the SPC rules.
For example, if the subgroup frequency is equal to 2, one point every two points is analyzed.
Measurement instrument type: the only measuring device available is STwrench.
Measurement instrument S/N: type the serial number of the measuring device. The maximum number of characters permitted is equal to 50.
Transducer S/N: type the serial number of the transducer, if used during the test.
Tightening direction: from the drop down list select the tightening direction. The available items are Clockwise and Counterclockwise.
Torque correction coefficient: type the torque correction coefficient. The value ranges from 0.10 to 99.99.
Angle correction coefficient: type the angle correction coefficient. The values ranges from 0 to 6553.
Torque category
Cycle start: the cycle start is the starting point of the test. It must be equal/lower of the final angle monitoring torque
If cycle start is set to zero or not defined, the STwrench automatically sets the value to the mean load.
Final angle monitoring torque: the final angle monitoring torque specifies the torque value from which the angle measurement starts.
The final angle monitoring torque must be equal or higher than the Minimum torque.
If final angle monitoring torque is set to zero or not defined, the STwrench automatically sets the value to Cycle start.
Control mode: the control mode selects the condition to control the torque.
It is possible to select either Min/Max or Target/Tolerance.
Minimum torque: minimum value of the torque. By default is the minimum torque defined in the joint configuration.
It is possible to change the default value typing a new value. This parameter is the available if Control mode is set to Min/Max.
Target torque: value of the target torque. By default is the target torque defined in the joint configuration.
It is possible to change the default value typing a new value.
Maximum torque: maximum value of the torque. By default is the minimum torque defined in the joint configuration.
It is possible to change the default value typing a new value. This parameter is the available if Control mode is set to Min/Max
Torque tolerance: the torque tolerance defines the maximum torque and the minimum torque according to the target torque specified. It is expressed in percentage. This parameter is the available if Control mode is set to Target/Tolerance
Change screw: type the change screw value. The value must be equal or higher than the Maximum torque.
Unit of measurement: select the unit of measurement to use.
Angle category
Residual angle threshold: type the value of the residual angle threshold. The value ranges from 1 to 45.
This parameter is available if the Strategy is set to Residual torque/angle.
Breakaway angle threshold: type the value of the breakaway angle threshold. The value ranges from 1 to 20.
This parameter is available if the Strategy is set to Residual torque/angle.
Target angle: type the value of the target angle.
This parameter is available if the Strategy is set to Residual torque/peak.
Time category
Ratchet time: type the value in seconds of the ratchet time. The value ranges from 0.1 s to 30.0 s
Adding a Joint check inspection trough the template file
Generate the Template file for inspections on a USB storage device (for more information, see Generating Tool check / Joint check template).
Put the USB storage device into the USB port of the own PC.
From the PC, open the USB storage device.
Open the file STpad_JointInspectionImportFile.xlsm. The following is displayed:
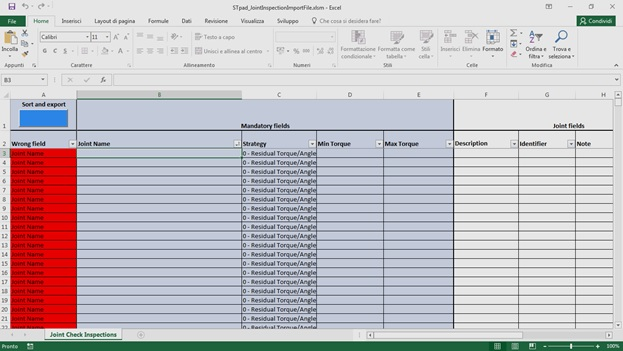
Complete the file STpad_JointInspectionImportFile.xlsm to define the necessary inspection(s).
When all the mandatory fields are filled in, the Wrong field column becomes green.
The file STpad_JointInspectionImportFile.xlsm defines not only inspection(s), but also the linked joint(s). These are automatically imported on the device through the file STpad_JointInspectionImportFile.stpad.
Check the Excel option for the workbook calculation. Open a Excel file and click File > Options. On left side of the Excel options dialog box, select Formulas > Automatic option for the Calculation options section.
When the Wrong field column in correspondence of the new inspection(s) is green colored, click the blue button Sort and export to automatically generate the file STpad_JointInspectionImportFile.stpad.
The file STpad_JointInspectionImportFile.stpad is automatically saved into the USB storage device.
Only the STpad_JointInspectionImportFile.stpad can be correctly imported on the device (for more information about how to import inspections, see Import inspections).
Save the file STpad_JointInspectionImportFile.xlsm.
Close the file STpad_JointInspectionImportFile.xlsm.
Close the USB storage device.
Remove the USB storage device from the USB port of the own PC.
Import the inspection(s) saved in the file STpad_JointInspectionImportFile.stpad on the device (for more information about how to import routes, see Importing the inspection(s) on the device).
Click the Menu icon > Joints to check the import of the inspection(s) is correctly done.
Deleting Joint inspection
On the upper-right corner of the Inspections category of the Joint page, tap Select.
On the left side of the Inspections category, select the check box of the inspection(s) to delete.
On the upper-right corner of the Joints page, tap Delete.
On the Confirmation required message, tap OK.
Editing Joint inspection
In the Joint page, select a joint.
In the Edit joint toolbar, tap Inspection.
In the Inspections category, tap the inspection to edit.
In the Edit inspection page, change the necessary parameters.
In the upper-right corner of the Edit inspection page, tap Save.
If the inspection is sent by an external software, it is not possible to edit it.
Running Joint inspection
In the Home page, tap Joint.
In the Joint page, tap Play for running the inspection.
If the configured wrench is not connected or its range is out of the test range, an Information message appear.
On the lower-right corner of the Information message, tap the Manage devices button to add/edit/pair another wrench to use during the test.
Do the test.
During the test, the following page is updated in real time.

A | Results chart | B | Results list |
On the left side of the Results page, the Results chart shows all the results of the inspection.
On the right side of the Results page, a list of the results of the inspection is displayed.
If a result is NOK, the measured value is highlighted in red. If the STwench does not reach the target torque, a dash (-) is shown in the results list and the counter of the done results is not incremented.
At the end of the test (or after two results if the number of samples is zero), above the results list the message Test Cp/Cpk ISO: OK (NOK) appears.
The inspection is OK if both Cp and Cpk are equal or greater than Minimum Cp Torque and Minimum Cpk Torque
In the lower part of the page, the following values are shown:
Minimum: minimum measured value.
Maximum: maximum measured value.
Average: average value of all measured values.
STD (σ): standard deviation of the measured values.
For Cp/Cpk inspection: Cp and Cpk values change after three results.
For SPC (joint) inspection: X and R values changes after three results.
When the subgroup is completed, the SPC rules check result window is displayed. In this window, the status of the SPC rules is shown. The inspection result depends on the enabled rules. If the rules results are positive, the inspection result is OK.
Below is the list of the rules results that can occur:
 : the rule result is OK.
 : the rule result is NOK.
 : the rule result is not enabled or it is not possible to make an analysis on it.
To delete one result (when enabled by external software), select it and tap the following icon: .
To delete the whole set of results (when enabled by external software), tap the following icon: .
For the SPC (joint) inspection, it is not possible to delete a result if the subgroup is completed.
To add a comment to a result, select it and tap the following icon: .
To add a picture to a result, select it and tap the following icon: .
Summary category for Cp/Cpk
In the upper part of the Run inspection page, tap Summary to displayed the statistics parameters related to the measured values.
This page opens automatically when the batch is completed.
The following parameters are shown:
Test results: result of the test (OK, NOK).
Minimum Cp: value of minimum Cp, configured in the inspection.
Cp: value of the Cp index calculated, by using the measured values.
Minimum Cpk: value of minimum Cpk, configure in the inspection.
Cpk: value of the Cpk index, calculated by using the measured values.
To restart the test: in the upper-right corner of the Summary category page, tap Restart test.
Summary category for SPC
When the subgroup defined in the SPC configuration is completed, the Summary category opens.
If one or more rules are violated, the SPC rules check result opens, showing the status of the rules.
If no rule is violated, the SPC rules check result is not shown.
After the dialog box appears, tap the Summary category.
In the Summary page, the following information are shown:
A | Add button | B | Restart test button |
C | Statistic parameters | D | Enabled rules |
The Add button is shown only for the SPC dimensional
The shown statistic parameters are:
X: it is the average value of the results of the Inspection.
R: it is the range value according to ISO standard.
S: saved values related to the subgroup size defined in inspection configuration.
Below the statistic parameters, the enabled rules and their status are indicated.
If the rule is marked in:
green: the rule is passed.
red: the rule is failed.
grey: the number of values is not enough to calculate the rule.
If a rule is disabled, it is not shown in the list.
Refer to the paragraph SPC rules for the procedure to enable/disable the SPC rules.
To restart the test, tap Restart test. The statistics are reset, and in the Summary page the results of the last test are shown.
To exit the test: on the upper-right corner of the Summary category, tap End test.
If the batch is completed, after the End test is tapped, the test is closed without showing any Confirmation message.
If the batch is not completed or the batch is set to zero, after the End test is tapped, a Confirmation massage is displayed.
To print the test label: on the upper-right corner of the Summary category, tap Print label.
In the label, the following information are shown:
Barcode related to the Tool ID.
Tool ID
Nominal value of the test (torque, angle or both)
Location of the tool
Test date
Date of the next test
Trace category
A | Trace toolbar | B | Trace with legend |
The Trace toolbar provides the following functionality:
Trace: select from the Trace drop-down box the plot to be displayed:
Torque v. time: torque-time plot of the last result.
Angle v. time: angle-time plot of the last result.
Angle/Torque v. Time: angle/torque-time plot are shown at the same time. A double vertical axis is shown on the chart.
Torque v. Angle: torque-angle plot of the last result.
Angle v. time, Angle/Torque v. Time and Torque v. Angle are available only in the following conditions:
The test runs on a brake.
The test runs on a transducer with angle measurement.
Limits: select the Limits button (
) to display the tolerance limits on the chart.
The graph shows the last result. After every new result, the trace shown is updated accordingly.
Angle trace from Cycle start: select the Angle trace from Cycle start button (
) to display the angle trace from the start of the test.On the lower-right corner of the Trace category, the brake status indicator shows that the measuring device is ready for the test (blue indicator
), or that the measuring device is not ready for the test (red indicator ).
If the indicator is red, wait until the indicator turns blue before acquiring the next value.
If the Double result function is enabled on the STwrench and on the device, both the residual point and the peak point are shown on the plot.
Parts
In the Home page, select Parts. The following is displayed:

A | Search button | B | Barcode button |
C | Command button | D | Play button |
E | List of Parts |
Below are the columns that define the list of Parts:
Name: name of the configured part.
Identifier: code to identify the part.
Play: icon to run the inspection. If the icon is unavailable, no inspection is available.
To sort the columns that define the list of Parts: tap the column to be sorted, the up arrow (placed on the right of the column heading) lists the Name (or Identifier) details in ascending alphabetical order; the down arrow lists the Name (or Identifier) details in descending alphabetical order.
To customize the sequence of the columns that defines the list of Parts: tap the column heading to moved (Name / Identifier), then drag and drop it to the necessary position.
When enabled by external software, the Barcode button () allows to scan a barcode to search the corresponding Part inspection(s) on the measuring device. If the search finds a single Part inspection, it is automatically run; if the search finds multiple Part inspections with the same barcode identifier, run the inspection of interest from the list.
The Play button gets active only after adding/updating the inspection(s) linked to the Joint. If enabled, tap Play to run the test.
Adding a Part
In the Home page, tap Parts.
On the upper-right corner of the Parts page, tap Add.

A
Save button
B
Parameters
In the General category of the Add part page, configure the part parameters.
On the upper-right corner of the Add part page, tap Save.
Part parameters
General category
Name: type the name of the part.
Identifier: type the identifier of the part.
Deleting a Part
In the Home page, tap Parts.
On the upper-right corner of the Parts page, click Select.
On the left side of the Parts page, select the check box of the part(s) to delete.
On the upper-right corner of the Parts page, tap Delete.
On the Confirmation required message, tap OK.
Editing a Part
From the Parts page, tap an existing part that needs to be modified.
The following is displayed:

A
Categories
B
Save button
C
Parameters
In the Edit part page, edit the necessary parameter(s) according to customer needs.
In the Inspection category, it is possible to configure the inspection(s) to perform on the part. For more information about how to update the Inspections category, see the paragraph Part inspections.
On the upper-right corner of the Edit part page, tap Save.
Searching a Part
In the Home page, tap Parts.
In the central part of the toolbar, tap the Search icon (
).In the Search text box, type the string to search.
Partial matching is supported: parts whose name or identifier match the text string are shown.
To delete the typed string, tap the Reset icon ().
To exit the search function, tap the Left arrow icon ().
Part inspections
The available inspections type for the Parts are:
Visual check – Attribute: this inspection is used when the user is asked to choose among a list of attributes that are visually inspected. It is possible to create a fixed list of attributes to be marked as OK or NOK for each specific inspection.
Visual check – Binary: this inspection is used as go/no go test. This is the most suitable inspection when the result of a test is binary: passed or failed.
Visual check – Instructions: this inspection is used when recommendations or separate instructions need to be shown to the measuring device user without requiring any specific action.
Visual check – Picture: this inspection consists in taking a picture of the part to be inspected; it is possible to compare it with a reference picture uploaded from external software and confirm/reject the part in production.
Dimensional check - Cp/Cpk
Dimensional check - SPC
It is possible to save two inspections with the same name and the same target object.
A warning message is displayed to inform the operator that an inspection with the same name already exists.
Select Yes to save the inspection.
Select No not to discard the inspection.
- Adding a Visual inspection
- Attribute inspection parameters
- Binary inspection parameters
- Instructions inspection parameters
- Picture inspection parameters
- Adding a Dimensional inspection
- Cp/Cpk dimensional parameters
- SPC dimensional parameters
- Deleting a Part inspection
- Editing Part inspection
- Running Part inspection
Adding a Visual inspection
In the Home page, tap Parts.
In the Parts page, tap a configured part.
On the upper part of the Edit part page, tap Inspections.
On the upper-right part of the Inspection category, tap Add.
In the Test type window, tap one of the Visual check inspections. In the following, an example of the Visual check- attribute inspection page. The structure is the same for all the inspections, only the categories change.

A
Categories
B
Save button
C
Parameters
In the General category of the Add visual – inspection page, configure the inspection parameters.
In the Add visual – inspection page, tap Picture.
In the Picture category, it is possible to:
Add an image/video: on a USB storage device, save the image/video to use in a folder named media_items, connect the storage device to the STpad and tap the Add button on the right side of the Picture page. In the Add picture dialog box, select the image/video to load and click OK.
The maximum size of images is 5 MB, the maximum size of videos is 10 MB.
Remove a picture: on the right side of the Picture page, tap the Remove button.
In the Add visual – inspection page, tap Traceability.
In the Traceability category of the Add visual – inspection page, configure the following parameters:
Verification code: type the verification code that must be entered or scanned when the inspection is run. This field is case-sensitive.
Verification code description: to guide the operator, type the description of the verification code dialog box that is displayed when the inspection is run.
Assignable causes: it is possible to:
List:
select an assignable causes list: tap the Search icon (
) and then select an already configured item in the Assignable causes list page.add a new assignable causes list: tap the Search icon (
); on the upper-right corner of the Assignable causes list page, tap Add to configure a new item.delete the link to the assignable causes list: tap the Delete icon (
).
Mandatory: if the check box is selected, the operator must select/type an assignable cause to continue the test.
Force selection from list: select between:
No: the operator can type the assignable cause, without selecting it from the list.
Yes: the operator can only select the assignable cause from the list.
Inherit: the selection from list can be forced or not forced, depending on the definition of this parameter in the Assignable causes list page.
Corrective actions: it is possible to:
List:
select a corrective actions list: tap the Search icon (
) and then select an already configured item in the Corrective actions list page.add a new corrective actions list: tap the Search icon (
); on the upper-right corner of the Corrective actions list page, tap Add to configure a new item.delete the link to the corrective actions list: tap the Delete icon (
).
Mandatory: if the check box is selected, the operator must select/type a corrective action to continue the test.
Force selection from list: select between:
No: the operator can type the corrective action, without selecting it from the list.
Yes: the operator can only select the corrective action from the list.
Inherit: the selection from list can be forced or not forced, depending on the definition of this parameter in the Corrective actions list page.
On the upper-right corner of the Add visual – inspection page, tap Save.
Attribute inspection parameters
General category
Name: type the name of the inspection.
Barcode identifier: it identifies the inspection. If left blank, the identifier corresponds to the inspection name.
Type: by default, it is set to Visual - Attribute.
Attribute list: it is possible to:
select an attribute list: near the attribute list box, tap the Search icon (
) and then select an already configured attribute list in the Attribute list page.add a new attribute list: near the attribute list box, tap the Search icon (
). On the upper-right corner of the Attribute list page, tap Add to configure a new attribute list.
Number of sample: type number of sample to test.
Binary inspection parameters
General category
Name: type the name of the inspection.
Barcode identifier: it identifies the inspection. If left blank, the identifier corresponds to the inspection name.
Type: by default, it is set to Visual - Binary.
Binary list: it is possible to:
select a binary list: near the binary list box, tap the Search icon (
) and then select an already configured binary list in the Binary lists page.add a new binary list: near the binary list box, tap the Search icon (
). On the upper-right corner of the Binary lists page, tap Add to configure a new binary list.
Number of sample: type the number of sample to test.
Instructions inspection parameters
General category
Name: type the name of the inspection.
Barcode identifier: it identifies the inspection. If left blank, the identifier corresponds to the inspection name.
Type: by default, it is set to Visual - Instructions.
Note category
In the Note category it is possible to type a maximum number of characters equal to 2000.
Picture inspection parameters
General category
Name: type the name of the inspection.
Barcode identifier: it identifies the inspection. If left blank, the identifier corresponds to the inspection name.
Type: by default, it is set to Visual - Picture.
Note category
In the Note category it is possible to type a maximum number of characters equal to 2000.
Adding a Dimensional inspection
In the Home page, tap Parts.
In the Parts page, tap a configured part.
On the upper part of the Edit part page, tap Inspections.
On the upper-right part of the Inspection category of the Edit part page, tap Add.
In the Test type window, tap one of the Dimensional check inspections. In the following, an example of the Dimensional check- Cp/Cpk inspection page. The structure is the same for all the inspections.

A
Categories
B
Save button
C
Parameters
In the General category of the Add dimensional - inspection page, configure the general parameters of the inspection.
In the Add dimensional - inspection page, tap Length (Quantity).
In the Length (Quantity) category of the Add dimensional - inspection page, configure the reference values of the inspection.
In the Add dimensional - inspection page, tap Picture.
In the Picture category, it is possible to:
Add an image/video: on a USB storage device, save the image/video to use in a folder named media_items, connect the storage device to the STpad and tap the Add button on the right side of the Picture page. In the Add picture dialog box, select the image/video to load and click OK.
The maximum size of images is 5 MB, the maximum size of videos is 10 MB.
Remove a picture: on the right side of the Picture page, tap the Remove button.
In the Add dimensional - inspection page, tap Traceability.
In the Traceability category of the Add visual – inspection page, configure the following parameters:
Verification code: type the verification code that must be entered or scanned when the inspection is run. This field is case-sensitive.
Verification code description: to guide the operator, type the description of the verification code dialog box that is displayed when the inspection is run.
Assignable causes: it is possible to:
List:
select an assignable causes list: tap the Search icon (
) and then select an already configured item in the Assignable causes list page.add a new assignable causes list: tap the Search icon (
); on the upper-right corner of the Assignable causes list page, tap Add to configure a new item.delete the link to the assignable causes list: tap the Delete icon (
).
Mandatory: if the check box is selected, the operator must select/type an assignable cause to continue the test.
Force selection from list: select between:
No: the operator can type the assignable cause, without selecting it from the list.
Yes: the operator can only select the assignable cause from the list.
Inherit: the selection from list can be forced or not forced, depending on the definition of this parameter in the Assignable causes list page.
Corrective actions: it is possible to:
List:
select a corrective actions list: tap the Search icon (
) and then select an already configured item in the Corrective actions list page.add a new corrective actions list: tap the Search icon (
); on the upper-right corner of the Corrective actions list page, tap Add to configure a new item.delete the link to the corrective actions list: tap the Delete icon (
).
Mandatory: if the check box is selected, the operator must select/type a corrective action to continue the test.
Force selection from list: select between:
No: the operator can type a custom corrective action, without selecting it from the list.
Yes: the operator can only select the corrective action from the list.
Inherit: the selection from list can be forced or not forced, depending on the definition of this parameter in the Corrective action list page.
On the upper-right corner of the Add dimensional - inspection page, tap Save.
Cp/Cpk dimensional parameters
General category
Name: type the name of the inspection.
Barcode identifier: it identifies the inspection. If left blank, the identifier corresponds to the inspection name.
Quantity: from the drop down list, select one of the available option: Length, Custom.
Number of sample: type the number of sample to test.
Cp Cpk minimum sample number: minimum number of sample to calculate the Cp/Cpk values.
Measurement device type: from the drop down list, select one of the available option: Manual input, Automatic only.
If the Automatic only mode is selected, make sure that the gauge data transfer is configured in keyboard emulation.
Length (Quantity) category
Minimum value: type the minimum allowed value. The value can be positive or negative.
Maximum value: Type the maximum allowed value. The value can be positive or negative.
Minimum Cp: type the minimum value of Cp.
Minimum Cpk: type the minimum value of Cpk.
(Custom) Unit of measurement: select the unit of measurement.
If Quantity value is set to Length, the available units of measurements are: mm, in.
If Quantity value is set to Custom, type the custom unit of measurement to use.
Decimal digits: type the number of the decimal digits to use.
This field is available only if Quantity value is set to Custom.
SPC dimensional parameters
General category
Name: type the name of the inspection.
Barcode identifier: it identifies the inspection. If left blank, the identifier corresponds to the inspection name.
Quantity: from the drop down list, select one of the available option: Length, Custom.
Subgroup size: type the value of the subgroup size. The default value is defined in Home > Configuration > Default values > Inspection default values.
Subgroup frequency: type the value of the subgroup frequency. The default value is defined in Home > Configuration > Default values > Inspection default values.
Number of sample: type the number of sample to test.
Measurement device type: from the drop down list, select one of the available option: Manual input, Automatic only.
If the Automatic only mode is selected, make sure that the gauge data transfer is configured in keyboard emulation.
Length (Quantity) category
Minimum value: type the minimum allowed value. The value can be positive or negative.
Maximum value: Type the maximum allowed value. The value can be positive or negative.
(Custom) Unit of measurement: select the unit of measurement.
If Quantity value is set to Length, the available units of measurements are: mm, in.
If Quantity value is set to Custom, type the custom unit of measurement to use.
Decimal digits: type the number of the decimal digits to use.
This field is available only if Quantity value is set to Custom.
Deleting a Part inspection
On the upper-right corner of the Inspections category of the Parts page, tap Select.
On the left side of the Inspections category, select the check box of the inspection(s) to delete.
On the upper-right corner of the Parts page, tap Delete.
On the Confirmation required message, tap OK.
Editing Part inspection
In the Parts page, select a part.
In the Edit part toolbar, tap Inspections.
In the Inspections category, tap the inspection to edit.
In the Edit inspection page, change the necessary parameters.
In the upper-right corner of the Edit inspection page, tap Save.
If the inspection is sent by an external software, it is not possible to edit it.
Running Part inspection
In the Home page, tap Parts.
In the Parts page, tap Play for running the inspection.
Do the test.
- Results category for Attribute inspection
- Results category for Binary inspection
- Results category for Instructions inspection
- Results category for Picture inspection
- Results category for Dimensional inspection
- Statistics category for Dimensional inspection
- Summary category for Cp/Cpk
- Summary category for SPC
Results category for Attribute inspection
In the Results category of the Run inspection page, the following is displayed:

A | Batch count | B | Command icons |
C | Results list | D | Add button |
E | Attribute list values |
On the left side of the Results category, the Value drop down list allows to select the attribute, configured in the attribute list linked to the inspection. After selecting a value, tap Add.
To add a custom value:
In the configuration of the Attribute list, deselect the Force selection from list check box. Thereby, in the Result page, the Custom value text box is displayed. In the text box, type the attribute to use. Then select OK or NOK and tap Add.
The custom value is use in the inspection, but it is not add to the Attribute list
On the right side of the Results category, a table shown all the selected values.
To delete one result (when enabled by external software), select it and tap the following icon: .
To delete the whole set of results (when enabled by external software), tap the following icon: .
To add a comment to a result, select it and tap the following icon: .
To add a picture to a result, select it and tap the following icon: .
Results category for Binary inspection
In the Results category of the Run inspection page, the following is displayed:

A | Batch count | B | Command icons |
C | Results list | D | Add button |
E | Binary list values |
On the left side of the Results category, the Value option buttons allow to select the value of the part under inspection. The values are configured in the binary list linked to the inspection.
After selecting one of the two available options, tap Add.
On the right side of the Results category, a table shows all the selected values.
To delete one result (when enabled by external software), select it and tap the following icon: .
To delete the whole set of results (when enabled by external software), tap the following icon: .
To add a comment to a result, select it and tap the following icon: .
To add a picture to a result, select it and tap the following icon: .
Results category for Instructions inspection
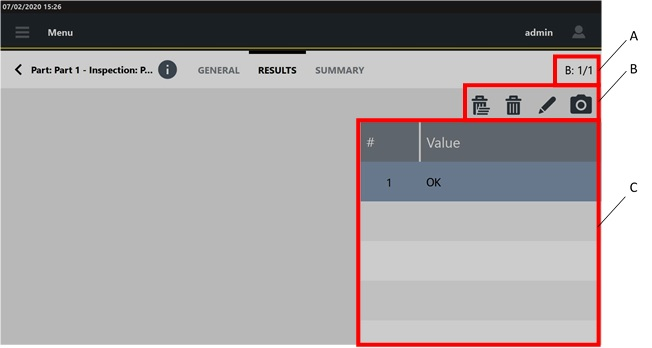
A | Batch count | B | Command icons |
C | Result list |
On the right side of the Results category, the table shows the result of the inspection.
To delete one result (when enabled by external software), select it and tap the following icon: .
To delete the whole set of results (when enabled by external software), tap the following icon: .
To add a comment to the result, tap the following icon: .
To add a picture to the result, tap the following icon: .
Results category for Picture inspection

A | Batch count | B | Command icons |
C | Result list |
On the right side of the Results category, the table shows the result of the inspection.
To delete one result (when enabled by external software), select it and tap the following icon: .
To delete the whole set of results (when enabled by external software), tap the following icon: .
To add a comment to the result, tap the following icon: .
Results category for Dimensional inspection
In the Results category of the Run inspection page, the following is displayed:
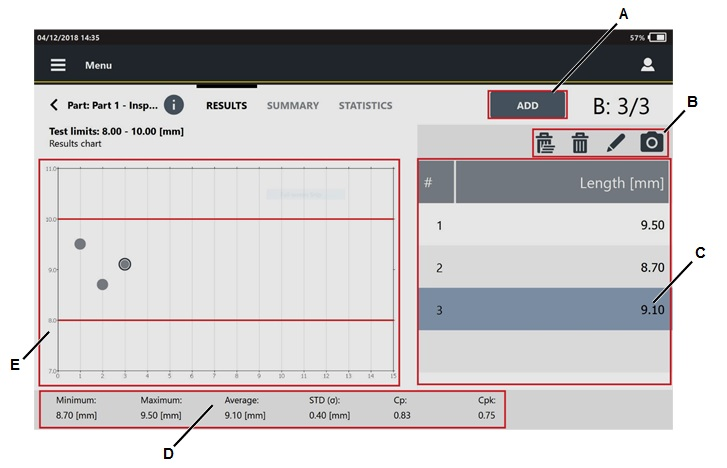
A | Add button | B | Command icons |
C | Results list | D | Statistics values |
E | Results chart |
On the left side of the Results page, the Result chart shows all the results of the inspection.
To add a result, tap Add, and then type the value in the Insert value dialog box.
On the right side of the Results page, the list of the results of the inspection is displayed.
If a result is NOK, the inserted value is highlighted in red.
The inspection is OK if both Cp and Cpk are equal or greater than Minimum Cp and Minimum Cpk.
In the lower part of the page, the following values are shown:
Minimum: minimum measured value.
Maximum: maximum measured value.
Average: average value of all measured values.
STD (σ): standard deviation of the measured values.
For Cp/Cpk (dimensional) inspection
Cp and Cpk values change after three results.
For SPC (dimensional) inspection
X and R values changes after three results.
When the subgroup is completed, the SPC rules check result window is displayed. In this window, the status of the SPC rules is shown. The inspection result depends on the enabled rules. If the rules results are positive, the inspection result is OK.
Below is the list of the rules results that can occur:
- : the rule result is OK.
- : the rule result is NOK.
- : the rule result is not enabled or it is not possible to make an analysis on it.
The inspection result depends on the enabled rules. If the rules results are positive, the inspection result is OK.
To delete one result (when enabled by external software), select it and tap the following icon: .
To delete the whole set of results (when enabled by external software), tap the following icon: .
For the SPC (dimensional) inspection, it is not possible to delete a result if the subgroup is completed.
To add a comment to a result, select it and tap the following icon: .
To add a picture to a result, select it and tap the following icon: .
Statistics category for Dimensional inspection
In the upper part of the Run inspection page, tap Statistics to displayed the statistics parameters related to the measured tvalues.
The following parameters are shown:
Samples: it is the number of acquired results.
Minimum: it is the minimum value between the results of the Inspection.
Maximum: it is the maximum value between the results of the Inspection.
Range: it is the range value according to ISO norm.
Average: it is the average value of the results of the Inspection.
STD (σ): it is the standard deviation (indicated with the Greek letter “Sigma”) of the results of the Inspection.
3σ/X: it is the value of the “3 sigma percentage” parameter (3 times the standard deviation) over the average value according to ISO norm.
X-3σ: it is the value of the “mean minus 3 times the standard deviation (sigma)” parameter according to ISO norm.
X+3σ: it is the value of the “mean plus 3 times the standard deviation (sigma)” parameter according to ISO norm.
Cp: it is the Cp value according to ISO norm.
Cpk: it is the Cpk value according to ISO norm.
OK: it is the percentage value of the results between minimum and maximum limit.
Low: it is the percentage value of the results under the minimum limit.
High: it is the percentage value of the results over the maximum limit.
Summary category for Cp/Cpk
In the upper part of the Run inspection page, tap Summary to displayed the statistics parameters related to the measured values.
This page opens automatically when the batch is completed.
The following parameters are shown:
Test results: result of the test (OK, NOK).
Minimum Cp: value of minimum Cp, configured in the inspection.
Cp: value of the Cp index calculated, by using the measured values.
Minimum Cpk: value of minimum Cpk, configure in the inspection.
Cpk: value of the Cpk index, calculated by using the measured values.
To restart the test: in the upper-right corner of the Summary category page, tap Restart test.
Summary category for SPC
When the subgroup defined in the SPC configuration is completed, the Summary category opens.
If one or more rules are violated, the SPC rules check result opens, showing the status of the rules.
If no rule is violated, the SPC rules check result is not shown.
After the dialog box appears, tap the Summary category.
In the Summary page, the following information are shown:
A | Add button | B | Restart test button |
C | Statistic parameters | D | Enabled rules |
The Add button is shown only for the SPC dimensional
The shown statistic parameters are:
X: it is the average value of the results of the Inspection.
R: it is the range value according to ISO standard.
S: saved values related to the subgroup size defined in inspection configuration.
Below the statistic parameters, the enabled rules and their status are indicated.
If the rule is marked in:
green: the rule is passed.
red: the rule is failed.
grey: the number of values is not enough to calculate the rule.
If a rule is disabled, it is not shown in the list.
Refer to the paragraph SPC rules for the procedure to enable/disable the SPC rules.
To restart the test, tap Restart test. The statistics are reset, and in the Summary page the results of the last test are shown.
To exit the test: on the upper-right corner of the Summary category, tap End test.
If the batch is completed, after the End test is tapped, the test is closed without showing any Confirmation message.
If the batch is not completed or the batch is set to zero, after the End test is tapped, a Confirmation massage is displayed.
To print the test label: on the upper-right corner of the Summary category, tap Print label.
In the label, the following information are shown:
Barcode related to the Tool ID.
Tool ID
Nominal value of the test (torque, angle or both)
Location of the tool
Test date
Date of the next test
Measuring Devices
The measuring devices section describes how to connect the device to the related measuring device (IRC-Connect, STwrench, STbench - in case of STpad, STpad cable adapter - in case of STpad).
The IRC-Connect and the STwrench need the bluetooth connection to be used.
The device can store up to 100 measuring devices into its own memory.
Start STpad to display the Home page. Then select Measuring Devices between the available features.
The following is displayed:

A | Command buttons | B | List of measuring devices |
Below are the columns that define the list of Measuring devices:
Name: it is the name of the measuring device paired/connected to the device.
Serial number: it is the serial number of the measuring device paired/connected to the device.
Device type: it is the type of the measuring device paired/connected to the device.
Connection type: it is the connection type of the measuring device paired/connected to the device.
The connections types are:IRC-B: for IRC-Connect and STwrench.
Ethernet: for STbench.
USB: for STpad cable adapter.
Status: it is the status of the measuring device paired/connected to the device. The available status are:
not paired: the measuring device has been created but it has never been paired with STpad.
paired: the configured measuring device has been paired with STpad.
connection up: the measuring device is connected with STpad.
connection down: the measuring device is off or out of range.
When a measuring device is disconnected from STpad, its status is Paired
For each measuring device type, only one Measuring device per time can be connected to the device.
It is possible to sort the columns that define the list of Measuring devices either in ascending or descending alphabetical order, according to customer needs. Hence, tap the column to be sorted (in the screen above the column NAME is selected): the up arrow (placed on the right of the column heading) lists the Measuring devices Name (or Serial Number / Device Type / Connection Type / Status) details in ascending alphabetical order; on the other hand, the down arrow lists the Measuring devices Name (or Serial Number / Device Type / Connection Type / Status) details in descending alphabetical order.
It is possible to customize the sequence of the columns that defines the list of Measuring devices, according to the customer needs. Hence, tap the column heading to be moved (i.e. NAME, SERIAL NUMBER, DEVICE TYPE, CONNECTION TYPE or STATUS); finally drag and drop it on the necessary position.
Deleting a Measuring Device
In the Home page, tap Measuring devices.
On the upper-right corner of the Measuring devices page, tap Select.
On the left side of the Measuring devices page, select the check box of the measuring device(s) to delete.
On the upper-right corner of the Measuring devices page, tap Delete.
On the Confirmation required message, tap OK.
Searching a Measuring device
In the Home page, tap Measuring devices.
In the central part of the toolbar, tap the Search icon (
).In the Search text box, type the name of the measuring device to search.
Partial matching is supported: measuring devices whose names match the text string are shown.
To delete the typed string, tap the Reset icon ().
To exit the search function, tap the Left arrow icon ().
IRC-Connect
Pairing the IRC-Connect
In the Home page, tap Measuring devices.
On the upper-right corner of the Measuring devices page, tap Add
In the Measuring devices type window, tap IRC-Connect.
After selecting IRC-Connect in the Measuring device type window, the Connection category is automatically displayed.
The General category is automatically filled after the pairing process.
In the Connection category, configure the following parameters:
Connection type: not available. It is set to IRC-B.
Trace read: select one of the following option for the trace reading from the IRC-Connect:
Always: the traces are always read.
NOK only: only NOK traces are read.
Never: the traces are never read.
Gyro compensation: select the check box to enable the gyro compensation.
In the Connection category, tap on Pair.
Switch on the IRC-Connect pressing the Power button placed on the main panel:

A
Main panel
B
Result LEDs
C
Radio LED
D
Power button
After IRC-Connect boot sequence is completed, press the Power button for five times: after two seconds the Radio LED is lit steady, and the Result LEDs start blinking in sequence.
The IRC-Connect is now in pairing mode. Tap Pair on the STpad.
At the end of the pairing process, on the Pairing window tap OK .
In the Add IRC-Connect page, the General section is automatically filled with the following information:
Name: name of the paired measuring device.
Serial number: serial number of the paired measuring device.
Firmware version: firmware version of the paired measuring device.
Notes: type the optional notes.
On the upper-right corner of the Add IRC-Connect page, tap Save.
Connecting the device to the IRC-Connect
Pair the IRC-Connect to be connected to the device (for more information, see the paragraph Pairing the IRC-Connect).
In the Home page, tap Measuring Devices.
In the Measuring devices page, tap the IRC-Connect to be connected to the device.
On the upper-right corner of the Edit IRC-Connect page, tap Connect.
If the connection process succeeded, on the upper-right corner of the device screen the IRC-C icon is shown.
In the Measuring device table, the Status of the IRC-Connect is Connection up.
To open the Measuring device page, tap the left arrow near Edit IRC-Connect.
If the IRC-Connect is saved on the device memory but it is not paired, in the Measuring Devices page, the Status of the IRC-Connect is Not paired.
If the IRC-Connect is paired to the device but not connected, in the Measuring Devices page, the Status of the IRC-Connect is Paired.
If the IRC-Connect is connected to the device, but it is either off or out of range, in the Measuring Devices page, the Status of the IRC-Connect is Connection down.
After each connection, in the General section of the Edit IRC-Connect page the firmware version of the IRC-Connect is updated.
Connected transducer
If the transducer connected to the measuring device is overloaded, a warning message is displayed to inform the operator about the status of the transducer.
When a transducer is used for the first time, an information message is displayed to inform the operator that the first usage date is set to the current date.
Select Yes to set the first usage date to the current date.
Select No not to set the date. If this option is selected, at the next transducer use, the message will be displayed again.
If the transducer calibration is expired, an Information message is displayed to inform the operator that the transducer must be calibrated. It is still possible to use the transducer for testing.
STwrench
Pairing STwrench
In the Home page, tap Measuring devices.
On the upper-right corner of the Measuring devices page, tap Add
In the Measuring devices type window, tap STwrench.
After selecting STwrench, the Connection category is automatically displayed.
The General category is automatically filled after the pairing process.
In the Connection category, configure the following parameters:
Connection type: not available. It is set to IRC-B.
Trace read: select one of the following option for the trace reading from the STwrench:
Always: the traces are always read.
NOK only: only NOK traces are read.
Never: the traces are never read.
Residual double results: select the check box to save torque/angle values of both the Residual point and the Peak point.
If the check box is not selected, only the torque/angle values of the Residual point are saved.Residual max torque behavior: select the check box to have a Not OK result status of the test, when the residual point is within the limit and the peak point goes beyond the maximum torque.
If the check box is not selected, the result status of the test is OK , when the residual torque is within the limit and the peak point goes beyond the maximum torque.
In the Connection category, tap on Pair.
On the STwrench keyboard, press ON (
 ) and then in sequence press: OFF (
 ), UP (
 ),ON () and DOWN (
 ).
).When the STwrench is in the Waiting PIN status, tap Pair on the STpad.
At the end of the pairing process, on the Pairing window tap OK.
On the upper-right corner of the Add STwrench page, tap Save.
Connecting the device to the STwrench
Pair the STwrench to be connected to the device (for more information, see the paragraph Pairing STwrench).
In the Home page, tap Measuring Devices.
In the Measuring devices page, tap the STwrench to be connected to the device.
On the upper-right corner of the Edit STwrench page, tap Connect.
If the connection process succeeds, on the upper-right corner of the device screen the STw icon is shown and on the STwrench display the IRCW icon is shown
In the Measuring device table, the Status of the STwrench is Connection up.
To open the Measuring device page, tap the left arrow near Edit STwrench.
If the STwrench is added on the device memory but it is not paired, in the Measuring Devices page, the Status of the STwrench is Not paired.
If the STwrench is paired to the device but not connected, in the Measuring Devices page, the Status of the STwrenchis is Paired.
If the STwrench is connected to the device, but it is either off or out of range, in the Measuring Devices page, the Status of the STwrench is Connection down.
Scanning a barcode with STwrench
The STwrench barcode scanner can be used to read barcodes and the value read is inserted in the selected field.
To use the STwrench as barcode reader, it must be paired and connected to the device.
STbench
Connecting the device to the IRC-Connect
Pair the IRC-Connect to be connected to the device (for more information, see the paragraph Pairing the IRC-Connect).
In the Home page, tap Measuring Devices.
In the Measuring devices page, tap the IRC-Connect to be connected to the device.
On the upper-right corner of the Edit IRC-Connect page, tap Connect.
If the connection process succeeded, on the upper-right corner of the device screen the IRC-C icon is shown.
In the Measuring device table, the Status of the IRC-Connect is Connection up.
To open the Measuring device page, tap the left arrow near Edit IRC-Connect.
If the IRC-Connect is saved on the device memory but it is not paired, in the Measuring Devices page, the Status of the IRC-Connect is Not paired.
If the IRC-Connect is paired to the device but not connected, in the Measuring Devices page, the Status of the IRC-Connect is Paired.
If the IRC-Connect is connected to the device, but it is either off or out of range, in the Measuring Devices page, the Status of the IRC-Connect is Connection down.
After each connection, in the General section of the Edit IRC-Connect page the firmware version of the IRC-Connect is updated.
Connected transducers
In the Transducers category of the Edit STbench page, the brakes, the static cells and the external transducers connected to the STbench are listed.
Tapping one of the listed transducers, the Channel page opens, where the transducer parameters are shown. These parameters are read from the transducer and it is not possible to modify them.
If the Trace simulation field of a brake is populated with the message "Advanced pressure setting required", please contact Atlas Copco Service Personnel.
A transducer is highlighted with a red colored bar if it has been overloaded or the calibration has expired.
If an overloaded transducer is select to run a test, a warning message is displayed to inform the operator about the status of the transducer.
When a transducer is used for the first time, an information message is displayed to inform the operator that the first usage date is set to the current date.
Select Yes to set the first usage date to the current date.
Select No not to set the date. If this option is selected, at the next transducer use, the message will be displayed again.
If the transducer calibration is expired, an Information message is displayed to inform the operator that the transducer must be calibrated. It is anyway possible to use the transducer for testing.
STpad cable adapter
Connecting the device to the STpad cable adapter
Connect the STpad cable adapter to the STpad via USB cable.
In the Home page, tap Measuring Devices.
In the Measuring devices page, tap the STpad cable adapter connected to the device.
The General category of the selected STpad cable adapter is automatically filled with information on the connected measuring device:
Name
Serial number
Firmware version
Notes: type notes on the measuring device.
In the Connection category, configure the following parameter:
Connection type: not available. It is set to USB.
COM: not available.
Trace read: select one of the following options for the trace reading from the STpad cable adapter:
Always: the traces are always read.
NOK only: only NOK traces are read.
Never: the traces are never read.
Connected transducer
If the transducer connected to the measuring device is overloaded, a warning message is displayed to inform the operator about the status of the transducer.
When a transducer is used for the first time, an information message is displayed to inform the operator that the first usage date is set to the current date.
Select Yes to set the first usage date to the current date.
Select No not to set the date. If this option is selected, at the next transducer use, the message will be displayed again.
If the transducer calibration is expired, an Information message is displayed to inform the operator that the transducer must be calibrated. It is still possible to use the transducer for testing.
Controllers
This section describes how to configure a specific controller (Power Focus 3000/4000/6000, Power MACS, Generic).
Start STpad to display the Home page. Then select Controllers between the available features.
The following is displayed:

A | Controllers Toolbar | B | List of Controllers |
Below are the columns that define the list of Controllers:
Name: it is assigned when the Controller is configured. For more information about how to edit the Tool name, see the paragraph “Editing a Controller”.
Serial number: it is assigned when the Controller is configured. For more information about how to edit the Serial number, see the paragraph “Editing a Controller”.
It is possible to sort the columns that define the list of Controllers either in ascending or descending alphabetical order, according to customer needs. Hence, tap the column to be sorted (in the screen above the column NAME is selected): the up arrow (placed on the right of the column heading) lists the Controllers name (or Serial Number) in ascending alphabetical order; on the other hand, the down arrow lists the Controllers name (or Serial Number) in descending alphabetical order.
It is possible to customize the sequence of the columns that defines the list of Controllers, according to the customer needs. Hence, tap the column heading to be moved (i.e. NAME or SERIAL NUMBER); finally drag it on the necessary position.
Adding a controller
In the Controllers page, tap Add placed on the right side of the controllers toolbar. The following is displayed:
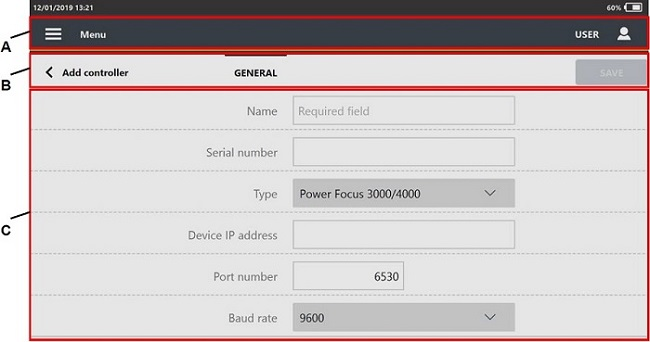
A
Add Controller Toolbar
B
Parameters
In General category, configure the controller parameters.
On the upper-right corner of the Add controller page, tap Save.
Controller parameters
General category
Name: type the name of the controller. The maximum number of characters is 50.
Serial number: type the Serial number of the controller. The maximum number of characters is 50.
Type: select the controller between the following:
Power Focus
Power MACS
Other controller
Open Protocol
Device IP Address: type the IP address of the controller. This parameter is available for controller type Power Focus and Open Protocol.
Port number: type the port number of the controller. This parameter is available for controller type Power Focus and Open Protocol.
Baud rate: select the baud rate. This parameter is unavailable for controller type Power MACS.
Deleting a controller
In the Home page, tap Controllers.
On the upper-right corner of the Controllers page, tap Select.
On the left side of the Controllers page, select the check box of the controller(s) to delete.
On the upper-right corner of the Controller page, tape Delete.
On the Confirmation required message, tap OK.
Editing a controller
From the Controller page, tap an existing Controller that needs to be modified.
The following is displayed:

A
Edit Controller Toolbar
B
Parameters
Edit the necessary parameter(s) according to customer needs.
On the upper-right corner of the Edit controller page, tape Save.
If the controller to edit is linked to one or more inspections, the type parameter is disabled.
Searching a Controller
In the Home page, tap Controllers between the available features.
In the central part of the toolbar, tap the Search icon (
).In the Search text box, type the name of the controller to search.
Partial matching is supported: controllers whose names match the text string are shown.
To reset the typed string, tap the Reset icon ().
To exit the search function, tap the Left arrow icon ().
Quick Programming - General Information
Quick Programming is a function that starts a test in a short time as specified in Quick Programming Default Values paragraph.
Before starting the quick programming test, connect the device to the related measuring device (for more information, see “Measuring devices”).
In case the device is connected to the STbench, run the Quick programming test through one of the following transducers: Brake, IRTT, IRTT T/A, SRTT, Motorized cell.
In case the device is connected to the IRC-Connect or Cable Adapter, run the Quick programming test through one of the following transducers: IRTT, IRTT T/A, SRTT.
Transducers and brake/cell operating working range: from 10% to 100% of the capacity.
The device automatically creates a default inspection (associated to a default tool) according to the tool, the connected transducer and the selected tool strategy.
For IRTT, IRTT T/A, SRTT, the following tool strategies are available: Click wrench – Click wrench, Click wrench - Cam-over, Peak – Peak, Power tool – Direct driven, Pulse tool – Pulse tool, Pulse tool – ACTA Pulse tool, Power tool - Only angle.
For brakes, the following tool strategies are available: Click wrench – Click wrench, Click wrench - Cam-over, Peak – Peak, Power tool – Direct driven, Power tool - Only angle.
For Motorized Cell, the following tool strategies are available: Click wrench – Click wrench, Click wrench - Cam-over, Peak – Peak.
For Motorized Cell it appears a window "Choose the parameters" with a selection of:
Tightening Direction: Clockwise/Counterclockwise
Target Torque: from 20% to 100% of Motorized Cell Nominal Torque
Number of samples: (0-1000)
For details refer to Tool Inspection paragraph.
It is possible to change the default inspection / tool that define the Quick programming test, according to customer needs. Moreover, users can also save the default inspection / tool in the related sections.
Running a quick programming
In the Home page, tap Quick Programming.
In the Select transducer dialog box, select the transducer to use.
If no devices are connected to the STpad, an error message is displayed.
In the Select tool strategy dialog box, select the strategy to use. The available strategies are:
The tool strategy changes depending on the transducer selected.
In case the transducer selected is IRTT, IRTT T/A, SRTT, the tool strategies available are as follows (regardless of the measuring device connected): Click wrench – Click wrench, Power tool – Direct driven, Peak – Peak, Pulse tool – Pulse tool, Pulse tool - ACTA pulse tool.
In case the transducer selected is the brake, the tool strategies available are as follows (in this case the STbench is the measuring device connected): Click wrench – Click wrench, Power tool – Direct driven, Peak – Peak.
in the Quick programming page, tap Play (
) to run the inspection.
On the upper-right corner of the Quick programming page, tap Save to save the configuration of the Tool and the inspection configured by the quick programming.
The configuration of the Tool and Inspection is editable.
Links
This section describes how to navigate web pages on the device.
The URLs available for navigation are enabled by external software.
If navigation on the device is enabled for one URL only, the name of the URL is displayed in the Home page.
Opening a link
In the Home page, tap Links.
Tap on the web page to open it and start navigating.
The web browser navigation bar is not be present on the device: navigation is limited to the configured URLs and some basic browser functionality are inhibited (such as: next, back, refresh, right-click, etc.).
To return to the Home page, tap on the Home icon
and select an item.
Configuration
Start STpad to display the Home page. Then select Configuration among the available features. The following is displayed:
Main data
From the Home page, tap Configuration > Main data.
From the Main data page it is possible to configure:
Attribute lists
Binary lists
Assignable causes lists
Corrective actions lists
Users
Traces
Attribute lists
In the Home page, tap Configuration > Main data > Attribute lists.
In the Attribute list table, the columns are:
Name: name of the attribute list.
Forced selection: this field allows two values:
True: it is not possible to add an item to the list during the test from the inspection page.
False: it is possible to add an item to the list during the test from the inspection page.
Adding an Attribute list
In the Home page, tap Configuration > Main data > Attribute lists.
On the upper-right corner of the Attribute lists page, tap Add.
In the General category of the Add attribute list page, configure the following parameters:
Name: name of the attribute list.
Force selection from list: if the check box is not selected, during the test it is possible to add a new item in the Custom value box.
In the Add attribute list page, tap Attribute.
In the Attribute category of the Add attribute list page, tap the Add icon.
In the field highlighted in red, type the name of the attribute list item.
From the NOK drop down list, select the status of the attribute to be check on the sample.
In the Name text box, type the value of the attribute.
In the upper-right corner of the Add attribute list, tap Save.
To move an item in the list:
In the Attribute category of the Add attribute list page, select the check box near the item name.
Tap the up/down arrow icon (
 ) to move up/down the item
On the upper-right corner of the Add attribute list page, tap Save.
To delete an item in the list:
In the Attribute category of the Add attribute list page, select the check box near the item name.
Tap the Delete icon (
) to delete the selected item.On the upper-right corner of the Add attribute list page, tap Save.
Deleting an Attribute list
In the Home page, tap Configuration > Main data > Attribute lists.
On the upper-right corner of the Attribute lists page, tap Select.
On the left side of the Attribute lists page, select the check box of the attribute list(s) to delete.
On the upper-right corner of the Attribute lists page, tap Delete.
On the Confirmation required message, tap OK.
Editing an Attribute list
In the Home page, tap Configuration > Main data > Attribute lists.
On the upper-right corner of the Attribute lists page, tap Add.
In the Edit attribute list page, tap Attribute.
In the Attribute category of the Add attribute list page, edit the parameter(s) according to the customer needs.).
In the upper-right corner of the Add attribute list, tap Save.
To move an item in the list:
In the Attribute category of the Edit attribute list page, select the check box near the item name.
Tap the up/down arrow icon to move up/down the item
On the upper-right corner of the Edit attribute list page, tap Save.
To delete an item in the list:
In the Attribute category of the Edit attribute list page, select the check box near the item name.
Tap the Delete icon to delete the selected item.
On the upper-right corner of the Edit attribute list page, tap Save.
Binary lists
In the Home page, tap Configuration > Main Data > Binary lists.
In the Binary list table, the column is:
Name: name of the binary list.
Adding a Binary list
In the Home page, tap Configuration > Main data > Binary lists.
On the upper-right corner of the Binary lists page, tap Add.
In the General category of the Add binary list page, configure the following parameters:
Name: name of the binary list.
Entry for OK: type the condition to pass the test.
Entry for NOK: type the condition not to pass the test.
In the upper-right corner of the Add binary list, tap Save.
Deleting a Binary list
In the Home page, tap Configuration > Main data > Binary list.
On the upper-right corner of the Binary lists page, tap Select.
On the left side of the Binary lists page, select the check box of the binary list(s) to delete.
On the upper-right corner of the Binary lists page, tap Delete.
On the Confirmation required message, tap OK.
Editing a Binary list
In the Home page, tap Configuration > Main data > Binary list.
In the Binary lists page, select an already configured binary list.
In the General category of the Edit binary list page, edit the parameter(s) according to the customer needs
In the upper-right corner of the Edit binary list page, tap Save.
Assignable causes lists
In the Home page, tap Configuration > Main data > Assignable causes lists.
In the Assignable causes lists table, the columns are:
Name: name of the assignable causes list.
Forced selection: this field allows two values:
True: it is not possible to add an item to the list during the test from the inspection page.
False: it is possible to add an item to the list during the test from the inspection page.
Adding an Assignable causes list
In the Home page, tap Configuration > Main data > Assignable causes lists.
On the upper-right corner of the Assignable causes lists page, tap Add.
In the General category of the Add assignable causes list page, configure the following parameters:
Name: name of the assignable causes list.
Force selection from list: if the check box is not selected, during the test it is possible to add a new item in the Custom value box.
In the Assignable causes list page, tap Assignable causes.
In the Assignable causes category of the Assignable causes list page, tap the Add icon.
In the field highlighted in red, type the name of the assignable causes list item. It is possible to add a maximum of 50 items for each Assignable causes list.
In the upper-right corner of the Add assignable causes list, tap Save.
To move an item in the list:
In the Assignable causes category of the Assignable causes list page, select the check box near the item name.
Tap the up/down arrow icon (
) to move up/down the item.On the upper-right corner of the Assignable causes list page, tap Save.
To delete an item in the list:
In the Assignable causes category of the Assignable causes list page, select the check box near the item name. It is possible to select more than one item to delete.
Tap the Delete icon (
) to delete the selected item(s).On the upper-right corner of the Assignable causes list page, tap Save.
Deleting an Assignable causes list
In the Home page, tap Configuration > Main data > Assignable causes lists.
On the upper-right corner of the Assignable causes lists page, tap Select.
On the left side of the Assignable causes lists page, select the check box of the assignable causes list(s)to delete.
On the upper-right corner of the Assignable causes lists page, tap Delete.
On the Confirmation required message, tap OK.
Editing an Assignable causes
In the Home page, tap Configuration > Main data > Assignable causes lists.
In the Assignable causes lists page, select an already configured assignable causes list.
In the General category of the Edit assignable causes list page, edit the parameter(s) according to the customer needs.
In the upper part of the Edit assignable causes list, tap Assignable causes.
In the Assignable causes category of the Edit assignable causes list page, edit the parameter(s) according to the customer needs.
In the upper-right corner of the Edit assignable causes list page, tap Save.
To move an item in the list:
In the Assignable causes category of the Edit assignable causes list page, select the check box near the item name.
Tap the up/down arrow icon to move up/down the item.
On the upper-right corner of the Edit assignable causes list page, tap Save.
To delete an item in the list:
In the Assignable causes category of the Edit assignable causes list page, select the check box near the item name.
Tap the Delete icon to delete the selected item.
On the upper-right corner of the Edit assignable causes list page, tap Save.
Corrective actions lists
In the Home page, tap Configuration > Main data > Corrective action lists.
In the Corrective actions lists table, the columns are:
Name: name of the Corrective action list.
Forced selection: this field allows two values:
True: it is not possible to add an item to the list during the test from the inspection page.
False: it is possible to add an item to the list during the test from the inspection page.
Adding a Corrective actions list
In the Home page, tap Configuration > Main data > Corrective action lists.
On the upper-right corner of the Corrective actions lists page, tap Add.
In the General category of the Add Corrective actions list page, configure the following parameters:
Name: name of the Corrective actions list.
Force selection from list: if the check box is not selected, during the test it is possible to add a new item in the Custom value box.
In the Corrective action list page, tap Corrective actions.
In the Corrective actions category of the Corrective actions list page, tap the Add icon.
In the field highlighted in red, type the name of the Corrective actions list item. It is possible to add a maximum of 50 items for each Corrective actions list.
In the upper-right corner of the Add Corrective actions list, tap Save.
To move an item in the list:
In the Corrective actions category of the Corrective actions list page, select the check box near the item name.
Tap the up/down arrow icon (
) to move up/down the item.On the upper-right corner of the Corrective actions list page, tap Save.
To delete an item in the list:
In the Corrective actions category of the Corrective action list page, select the check box near the item name. It is possible to select more than one item to delete.
Tap the Delete icon (
) to delete the selected item(s). On the upper-right corner of the Corrective actions list page, tap Save.
Deleting a Corrective actions list
In the Home page, tap Configuration > Main data > Corrective actions lists.
On the upper-right corner of the Corrective actions lists page, tap Select.
On the left side of the Corrective action lists page, select the check box of the Corrective actions list(s)to delete.
On the upper-right corner of the Corrective actions lists page, tap Delete.
On the Confirmation required message, tap OK.
Editing a Corrective actions list
In the Home page, tap Configuration > Main data > Corrective action lists.
In the Corrective actions lists page, select an already configured Corrective actions list.
In the General category of the Edit Corrective actions list page, edit the parameter(s) according to the customer needs.
In the upper part of the Edit Corrective actions list, tap Corrective actions.
In the Corrective actions category of the Edit Corrective actions list page, edit the parameter(s) according to the customer needs.
In the upper-right corner of the Edit Corrective actions list page, tap Save.
To move an item in the list:
In the Corrective actions category of the Edit Corrective actions list page, select the check box near the item name.
Tap the up/down arrow icon to move up/down the item.
On the upper-right corner of the Edit Corrective actions list page, tap Save.
To delete an item in the list
In the Corrective actions category of the Edit Corrective actions list page, select the check box near the item name.
Tap the Delete icon (
) to delete the selected item.On the upper-right corner of the Edit Corrective actions list page, tap Save.
Users
In the Home page, tap Configuration > Main data > Users.
In the Users table, the columns are:
User: login name.
Name: first name and last name of the user.
To sort the columns that define the list of Users: tap the column to be sorted, the up arrow (placed on the right of the column heading) lists the User (or Name) details in ascending alphabetical order; the down arrow lists the User (or Name) details in descending alphabetical order.
To customize the sequence of the columns that defines the list of Users: tap the column heading to be moved (User / Name), then drag and drop it to the necessary position.
The results of the test performed are linked to the logged user.
Adding a User
In the Home page, tap Configuration > Main data > User.
On the upper-right corner of the User page, tap Add.
In General category of the Add user page, configure the following parameters:
Login name: type the user name. This name will be used for the login.
Password: type the password used for the login of the user.
Follow these requirements for the Password:
The Password must be 8 to 25 characters long.
The Password must have one upper case character (at least).
The Password must have one lower case character (at least).
The Password must have one number (at least).
Empty spaces are permitted.
Upper/lower case characters with accent are not upper/lower case characters.
CODE 39 character set is permitted.
Confirm password: type again the password.
If the string typed in the Password text box and Confirm password text box are different, the Confirm password text box is red highlighted.
First name: type the name of the user.
Last name: type the last name of the user.
Has password: select the check box to require the password at the user login.
If the Has password check box is not selected, at the Login the user must leave empty the password text box.This case is useful to have the traceability of the results without the password request at the login.
On the upper-right corner of the Add user page, tap Save.
Deleting a User
In the Home page, tap Configuration > Main data > Users.
On the upper-right corner of the Users page, tap Select.
On the left side of the Users page, select the check box of the user(s) to delete.
On the upper-right corner of the Users page, tap Delete.
On the Confirmation required message, tap OK.
If a logged in user deletes the own profile, it remains active until the user logs out and the performed results are linked to the deleted user.
Editing a User
From the Configuration > Main data > Users page, tap an existing user that needs to be modified.
The following is displayed:

A
Categories
B
Save button
C
Parameters
In the Edit User page, edit the necessary parameter(s) according to customer needs.
On the upper-right corner of the Edit User page, tap Save.
Traces
The Traces menu is available only if the Trace simulation license is active on the device.
The Traces menu can be disabled by external software.
In the Home page, tap Configuration > Main data > Traces.
In the Traces table the columns are:
Name: name of the trace.
Notes: remarks on the trace.
Adding a Trace
In the Home page, tap Configuration > Main data > Traces.
On the upper-right corner of the Trace page, tap Add.
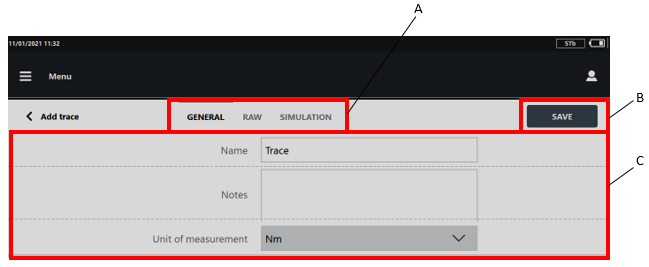
A
Categories
B
Save button
C
Parameters
In the General category, configure the general parameters of the trace.
In the upper part of the Add trace page, tap the Raw category and import and/or acquire up to 10 traces. Then, select the raw traces to process.
In the upper part of the Add trace page, tap the Simulation category and adjust the parameters of the simulated curve if necessary.
On the upper-right corner of the Add trace page, tap Save.
Importing a Raw Trace
This feature allows to import traces from an external software, by importing data from a file.
For information on the file, refer to Requirements for raw traces files
On the USB storage device, create a directory and rename it curves.
Add the curves to the directory. The file formats supported are .qap and .txt.
Insert the USB storage device into the USB port of the device.
In the upper-right corner of the Raw category, tap Import.
In the Select file dialog box, select the curve to import.
It is possible to import up to 10 traces. When the maximum number of traces to import is reached, the Import button is disabled.
Acquiring a Raw Trace
This feature allows acquiring a trace using an IRTT/A.
In the upper-right corner of the Raw category, tap Acquire.
In the Raw traces acquisition window, acquire the traces.
When the maximum number of traces to acquire is reached, the message "No more measurements required for the current test" is displayed.
Tap OK.
Deleting a Raw Trace
In the upper-right corner of the Raw category, tap Select.
Select the check box of the raw trace(s) to delete.
Raw traces marked as "in use" cannot be deleted.
In the upper-right corner of the Raw category, tap Delete.
In the Confirmation required message, tap OK.
Simulating a Trace
By simulating a trace, the raw traces previously imported and/or acquired are processed in order to generate the trace that the STbench will simulate during the test.
On the upper-right corner of the Raw category, tap Select.
Select the check box of the traces to include in the simulation.
On the upper-right corner of the Raw category, tap Process.
In the Simulation category it is possible to:
adjust the Polynomial fit (by default set to 7)
adjust the Start projection (by default set to 5%)
adjust the End projection (by default set to 5%)
show/hide raw traces (by default enabled)
show/hide average trace (by default enabled)
align the raw traces with the torque peak (by default enabled)
Tap the Test button to test the simulated trace.
The trace is sent to the STbench and the test starts on one of the brakes. In this way, it is possible to evaluate the quality of the trace approximation and to verify that the test can be run.The software does not automatically select the brake based on the curve and the brake capacity. Make sure to select the most suitable brake to run the test.
In the Simulation test screen it is possible to acquire up to 10 test traces (from the eleventh onwards, the oldest traces are progressively deleted).
By clicking on the Align at the torque peak button ( ) the curve to simulate and the simulated ones are aligned at the torque peak.
A
Align at torque peak button
Exit the Simulation test screen and then tap Save to save the parameters of the simulated trace.
Editing a Trace
In the Home page, tap Configuration > Main data > Traces.
In the Trace page, tap on an existing Trace.
In the Edit Trace page, edit the necessary parameters.
In the General category, the general parameters of the trace are displayed.
In the Raw category, it is possible to edit the list of imported/acquired traces, and select the raw traces to process.
In the Simulation category, it is possible to adjust the parameters of the simulated trace if necessary.
In the upper-right corner of the Edit trace page, tap Save.
Deleting a Trace
In the Home page, tap Configuration > Main data > Traces.
On the upper-right corner of the Trace page, tap Select.
On the left side of the Trace page, select the check box of the trace(s) to delete.
On the upper-right corner of the Trace page, tap Delete.
On the Confirmation required message, tap OK.
External systems
From the Home page, tap Configuration > External systems.
From the External systems page it is possible to configure:
API communication
Open Protocol communication
SIGOP/SCOUP integration
Tool tracker
API configuration
In the Home page, tap Configuration > External system > API configuration.
In the API Port field, type the number of the port to use for the communication with the devices and tap on Save.
The maximum value allowed is 65535, the default value is 60005.
Open Protocol
In the Home page, tap Configuration > External systems > Open Protocol.
To enable the Open Protocol, select the Enabled check box and type the number of the port to use in the Open Protocol Port field. Then, tap on Save.
By default, the Enabled checkbox is not selected.
Below are the available MIDs (Message Identification):
MID | Description | Revision ranges |
|---|---|---|
0001 | Communication start | 0 ÷ 1 |
0002 | Communication start acknowledge | 0 ÷ 5 |
0003 | Communication stop | 0 ÷ 1 |
0004 | Command error | 0 ÷ 1 |
0005 | Command accepted | 0 ÷ 1 |
0010 | Pset ID upload request | 0 ÷ 1 |
0011 | Pset ID upload response | 0 ÷ 1 |
0014 | Pset selected subscribe | 0 ÷ 1 |
0015 | Pset selected | 0 ÷ 2 |
0016 | Pset selected acknowledge | 0 ÷ 1 |
0017 | Pset selected unsubscribe | 0 ÷ 1 |
0018 | Select Pset | 0 ÷ 1 |
0060 | Last tightening result data subscribe | 0 ÷ 1 |
0061 | Last tightening result data | 0 ÷ 7 (+999) |
0062 | Last tightening result data acknowledge | 0 ÷ 1 |
0063 | Last tightening result data unsubscribe | 0 ÷ 1 |
0064 | Old tightening result upload request | 0 ÷ 1 |
0065 | Old tightening result upload response | 0 ÷ 6 |
0080 | Read time upload request | 0 ÷ 1 |
0081 | Read time upload response | 0 ÷ 1 |
9999 | Keep alive message | 0 ÷ 1 |
SIGOP/SCOUP
In the Home page, tap Configuration > External systems > SIGOP/SCOUP.
In the SIGOP/SCOUP page it is possible to:
Configure the SIGOP/SCOUP integration
Import route
Export results
Configuring the SIGOP/SCOUP integration
In the Home page, tap Configuration > SIGOP/SCOUP > Configuration.
Select the Enabled check box to activate the SIGOP/SCOUP integration.
In the Route input file path field, type the path of the file that contains the tests to import.
If the path typed is relative, the STpad searches the file into the first available device from the Network location and the Devices with Removable Storage.
In the Test output file path field, type the path of the file where the results are exported.
If the path typed is relative, the STpad writes the file into the first available device from the Network location and the Devices with Removable Storage.
From the Import inspection as drop-down list select between:
Cm/Cmk ISO, to import tests from the route file as Cm/Cmk ISO inspections.
SPC, to import tests from the route file as SPC inspections.
When importing Cm/Cmk ISO inspections, the batch size is taken from global default value(Configuration > Default values > Inspection default values > Number of samples).
When importing SPC inspections, the batch size is taken from route input file.
Select the Ask VIN check box to request the VIN when running an inspection.
Tap on the Save button.
Importing a route from the SIGOP/SCOUP file
In the Home page, tap Configuration > External systems > SIGOP/SCOUP > Import route.
When the import is completed, in the Home page tap on the Route menu to display the inspections imported.
Exporting results to SIGOP/SCOUP file
In the Home page, tap Configuration > SIGOP/SCOUP > Export results.
When the export is completed, the file is created in the path specified in the SIGOP/SCOUP configuration menu.
Tool tracker
In the Home page, tap Configuration > External systems > Tool tracker.
The Tool tracker enables the recording of the following information related to the results of an SPC inspection:
DATUHRSTART: date and time of the results.
WKZ_NAME: tool number.
WKZ_HERST: manufacturer.
WKZ_MODELL: model number.
WKZ_SERNR: serial number of the tool.
WKZTECHNO: tool type. The available types are: 1 = power, 2 = pulse, 3 = click, 4 = peak.
PRUEFER: tester name.
UG: lower limit of the torque range.
SOLL: torque target.
OG: upper limit of the torque range.
LFDNR: progressive number of torque value in the SPC inspection.
WERT: measured torque value.
Only the configured information are recorded
Configuring the Tool tracker
In the Home page, tap Configuration > External systems > Tool tracker
In the Tool tracker configuration page, configure the following parameters:
Enable: select the check box to enable the recording of the information listed above.
File name: type the path of a file to record the result information. The file must be created by the operator.
Export mode: select between:
Measure by measure: the values of a measure are exported in the file after each completed measure.
Test completed: the measures are exported in the file when the test is completed or abandoned.
Exported file: select between:
Daily rotation: a new file is created when the first measure of the day is acquired.
Single test: a new file is created at the end of each test.
Unique: all the measures are exported in a single file.
In the upper-right corner of the Tool tracker configuration page, tap Save.
Import / Export
From the Home page, tap Configuration > Import / Export.
From the Import / Export page it is possible to:
Create template files for inspections and routes
Import tool check inspections
Import joint check inspections
Import routes
Export results
It is possible to import on the device the inspections configured on STa 6000. The file to import is created by ToolsTalk BLM. This function is available from the ToolsTalk version 10.12x.
Refer to the STa 6000 User Guide for more information about the inspections export.
Templates
To import inspections (tool check and joint check) and routes from the PC to the device, it is necessary to first export the template files from the device, then edit the file adding the tests, and finally transfer the edited files to the device.
Generating the template file for tool check inspections
Template file for Tool Check Inspections is the source file that makes inspection(s) from the own PC through an external device (i.e. USB storage device).
Do the following procedure to create inspection(s) from the own PC:
Insert the USB storage device into the USB port of the device.
From the Home page, tap Configuration > Import / Export > Templates > Template file for Tool Check Inspections.
If the USB storage device is not connected to the USB port of the device, the message External device not found is displayed.
Insert the USB storage device into the USB port of the device and continue the procedure.
Tap Generate. At the end of the process, the message The file was correctly generated on the selected drive is displayed. Then, tap OK
If the template file is already stored on the USB storage device, the message The file already exists. Do you want overwrite? is displayed.
Tap OK to overwrite the old template file.
Tap Cancel to go back to the Template file for Tool Check Inspections page.
Generating the template file for joint check inspections
Template file for Joint Check Inspections is the source file that makes inspection(s) from the own PC through an external device (i.e. USB storage device).
Do the following procedure to create inspection(s) from the own PC:
Insert the USB storage device into the USB port of the device.
From the Home page, tap Configuration > Import / Export > Templates > Template file for Joint Check Inspections.
If the USB storage device is not connected to the USB port of the device, the message External device not found is displayed.
Insert the USB storage device into the USB port of the device and continue the procedure.
Tap Generate. At the end of the process, the message The file was correctly generated on the selected drive is displayed. Then, tap OK
If the template file is already stored on the USB storage device, the message The file already exists. Do you want overwrite? is displayed.
Tap OK to overwrite the old template file.
Tap Cancel to go back to the Template file for Joint Check Inspections page.
Generating the template file for routes
Template file for routes is the source file that makes route(s) from the own PC through an external device (i.e. USB storage device).
Do the following procedure to create route(s) from the own PC:
Insert the USB storage device into the USB port of the device.
Click Configuration > Import / Export > Templates > Template file for routes.
If the USB storage device is not connected to the device, the message No drive found is displayed.
Insert the USB storage device into the USB port of the device and continue the procedure.
Tap Generate. At the end of the process, the message The file was correctly generated on the selected drive is displayed. Then, tap OK
If the template file is already stored on the USB memory stick, the message The file already exist. Do you want overwrite? is displayed.
Tap OK to overwrite the old template file.
Tap Cancel to go back to the Template file for routes page.
Importing tool check inspections on the device
Configure the inspection to import on the device in the file STpad_ToolInspectionImportFile.xlms. Then, save the file STpad_ToolInspectionImportFile.stpad on the USB storage device (for more information, see Adding a Tool check inspection through the template file).
Insert the USB storage device into the USB port of the device.
From the Home page, tap Configuration > Import / Export > Import tool check.
Tap Import file. The Message If you continue, the database will be overwritten with the imported one. Do you want to continue? is displayed
Tap OK to overwrite the database with the imported inspection(s).
At the end of the import process, the following is displayed:
Tap OK to complete the import process.
Importing joint check inspections on the device
Configure the inspection to import on the device in the file STpad_JointInspectionImportFile.xlms. Then, save the file STpad_JointInspectionImportFile.stpad on the USB storage device (for more information, see Adding a Joint check inspection through the template file).
Insert the USB storage device into the USB port of the device.
From the Home page, tap Configuration > Import / Export > Import joint check.
Tap Import file. The Message If you continue, the database will be overwritten with the imported one. Do you want to continue? is displayed
Tap OK to overwrite the database with the imported inspection(s).
At the end of the import process, the following is displayed:
Tap OK to complete the import process.
Importing routes on the device
Configure the routes to import in the file Template file for routes (for more information, see the paragraph Adding Route(s) through the Template file).
Insert the USB memory stick into the USB port of the device.
From the Home page, tap Configuration > Import / Export > Import routes.
Tap Import file. The message If you continue, the route list will be updated with the imported one. Do you want to continue? is displayed.
Tap OK to update the route list with the imported routes.
At the end of the import process, the following is displayed:

If the rules given in the paragraph “Adding Route(s) through the Template file” are not followed, at the end of the import process the Import results window displays both OK results and NOK results:
In the above example, Route 1 is OK; Route 2 is skipped as it does not complies with the rules for the template file for routes.
Tap OK to complete the import process.
Exporting results
Insert the USB storage device into the USB port of the device.
From the Home page, tap Configuration > Import / Export > Export results.
If the USB storage device is not into the USB port of the device, the message External device not found is displayed.
The results were exported to the file export-result-20170411-181303.txt.
Tap OK to close the message. Then, insert the USB storage device into the USB port of the device and continue the procedure.
The file export-result-20170411-181303.txt is automatically saved on the USB storage device.
Tap OK.
Remove the USB storage device from the USB port of the device.
Insert the USB storage device into the USB port of the PC.
It is recommended to open the file export-result-20170411-181303.txt with Microsoft Excel.
Inspection values
From the Home page, tap Configuration > Inspection values.
From the Inspection values page it is possible to configure:
SPC rules
Default values for Cm/Cmk ISO, SPC, and ISO 6789 inspections
ISO 5393 default values
Quick programming default values
SPC Rules
In the Home page, tap Configuration > Inspection values > SPC Rules. The following is displayed:

A
Categories
B
Save button
C
Drop-down menu
D
Check boxes
On the right side of the SPC rules page, tap the check boxes to enable/disable the necessary SPC rules.
It is possible to configure different sets of rules for the Tool check, Joint check, and Dimensional check inspections by selecting the category of interest.
From the Show SPC rules summary popup drop-down menu, select one of the following items:
Always: to always display the SPC rules summary popup with all the SPC rules.
NOK only: to display in the SPC rules summary popup only the NOK SPC rules.
Never: to never display the SPC rules summary popup.
It is possible to configure different SPC Popup Display mode for the Tool check, Joint check, and Dimensional check inspections by selecting the category of interest.
On the upper-right corner of the SPC rules page, tap Save.
Common values
Tap Configuration > Inspection values > Common values. The following is displayed:

The Common values page lists the default values of the variables that characterize the test types Cm/Cmk ISO, SPC, ISO 6789.
Editing inspection common values
Tap the text box related to the value to modify.
Type the new value.
On the upper-right corner of the page, tap Save.
If the typed value is outside the range defined in the brackets, the text box is highlighted in red.
ISO 5393 default values
Tap Configuration > Inspection values > ISO 5393 default values. The following is displayed:
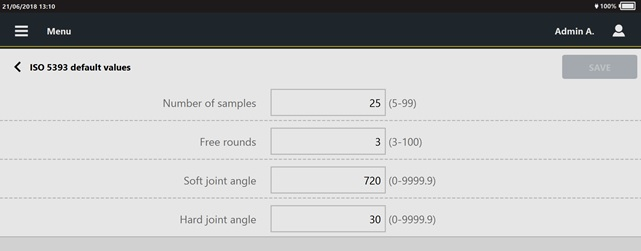
The ISO 5393 default values page lists the default values of the variables that characterize the test type ISO 5393.
Editing ISO 5393 default values
Click the text box related to the value to be modified.
Type the necessary value.
Click the check mark to confirm the update.
Obey the limits in brackets for the values of number of samples, subgroup size and subgroup frequency.
If the specified default value is wrong and does not obey the limits, the area around the text box is red circled (see the screen below).
Quick programming default values
Tap Configuration > Inspection values > Quick programming default values. The following is displayed:

The Quick programming default page allows to select the inspection type for the quick programming test.
Editing quick programming default values
Select between Cm/Cmk and CAM/Cpk.
Click the check mark to confirm the update.
General settings
From the Home page, tap Configuration > General settings.
From the General settings page it is possible to configure:
Common settings
Label printing
Measure screen
Reaction bar warnings
Test run settings
Common
In the Home page, tap Configuration > General settings > Common. The following is displayed:

A | Save button |
Enable login: by selecting/deselecting the checkbox, it is possible to enable/disable the request of Username and Password at the login.
When the Enable login check box is selected, the following screen is displayed when powering ON the STpad:

Enable login selected When the Enable login check box is not selected, the following screen is displayed when powering ON the STpad:

Enable login not selected
Enable virtual keyboard: by selecting/deselecting this checkbox, it is possible to enable/disable the virtual keyboard.
By default, the Enable virtual keyboard checkbox is selected.
When the virtual keyboard is disabled and a physical keyboard is not available, click on the Keyboard icon ( ) displayed on the upper-right corner of the login page and enter the credentials by means of the virtual keyboard.
To restore the setting, shut down and then restart the device.
Welcome page: from the drop-down menu, select the menu to display when starting the device. The options are:
Home
Route
Tools
Joints
Parts
Label
In the Home page, tap Configuration > General settings > Label.
To configure the label printing, set the following parameters:
General category
Default printer: select the printer to use for the label printing.
The supported printers are: Brother PT-P950 NW, Zebra GX 420t, and Toshiba TEC B-EV4.Standard size: select the size of the default label to print.
The available sizes are: 50 x 25, 57 x 25, 68 x 25. All the size are in millimeters.Standard orientation: select the orientation of the default label to print.
The two option are: portrait and landscape.
Inspections category
For each inspection type, select the label template to use from the drop-down menu.
Templates category
To create customized label templates, please contact Atlas Copco Service Personnel.
To import a custom label template:
Copy the custom template file on a USB storage device in a subfolder named label_templates.
Insert the USB into the USB port of the device.
Tap on the Import button and select the file of interest.
To delete a custom label template:
Tap on the Select button and select the check box(es) of the label template(s) to delete.
Label templates that are currently in use cannot be selected and deleted.
Tap on the Delete button.
The label can be printed for tool calibrations, Cm/Cmk, SPC, ISO 6789 and VDI-VDE inspections.
The label of tool calibrations displays the following information:
Tool ID
Operator
Last check
Next check
Calibration value
The "Next check" indicated in the label is always the expiry date in the event that the test result is OK. The calculation of the "Next check" date is not affected by the test OK or NOK status.
Measure screen
In the Home page, tap Configuration > General settings > Measure screen to enable/disable the display of the following Running measure popup while running a test:
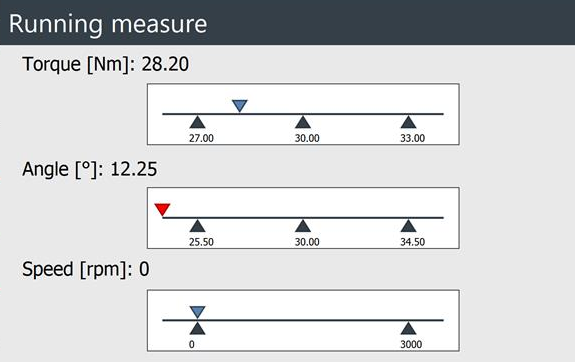
Tap on the check boxes to enable/disable the popup for tests on the following tools:
Click wrench
Power tool
Peak
Pulse tool
By default, the measure overlay is enabled for all tools.
Show tooltip: when the checkbox is selected, the details on the ongoing inspection are displayed by default in the measure screen:

Reaction bar
In the Home page, tap Configuration > General settings > Reaction bar.
To configure the reaction bar warning, set the following parameters:
By enabling the warning, a popup is displayed each time a test is started.
Warning enabled: select the check box to enable the warning messages.
By default, the warning messages are enabled for power tools.
Warning enabled for pulse tools: select the check box to enable the warning messages for pulse tools.
Minimum suggested torque: type the minimum torque value from which a warning message suggesting the use of the reaction bar is displayed. The default value is 10 Nm.
From the warning message, tap on OK to continue the test.
Minimum mandatory torque: type the minimum torque value from which a warning message requiring the use of the reaction bar is displayed. The default value is 15 Nm.
From the warning message, tap on OK to confirm that the reaction bar is use and start the test; if the reaction bar is not in use, tap on NO and cancel the test.
Torque unit of measurement: from the drop-down list, select the unit of measurement.
Test run
In the Home page, tap Configuration > General settings > Test run. The following is displayed:

Enable transducer from minload: when the checkbox is unselected, the transducers whose minimum operating range value is lower than the inspection minimum torque value can be used to run the test.
When the checkbox is selected, the transducers whose minimum load value is lower than the inspection minimum torque value can be used to run the test.
By default, the Enable transducer from minload checkbox is disabled.
LED ring timeout: type the value in milliseconds after which the OK (green) and NOK (red) LEDs on the STbench turn off.
If the value is set to 0 ms, the LED ring is always white.
Use brake over nominal torque: by selecting this check box, it is possible to run tests on the STbench brakes where the inspection maximum torque exceeds the brake operating range.
Force tuning tightenings: by selecting this check box, tests on the STbench brakes always start with the optimization of the braking.
Maintenance
From the Home page, tap Configuration > Maintenance.
From the Maintenance page it is possible to:
Manage licences
Backup the database of the application
Restore the database of the application
Configure log levels
Export application logs
Export STbench logs
Update the software
License
From the Home page, click Configuration > Maintenance > License. The following is displayed:

A | Command buttons | B | List of Licenses |
In the License table, the column are:
License: type of license available.
Status: status of the license. The available statuses are: "Active" and "Not active".
Refer to the "Activating a license" paragraph to add and activate a license.
Reset ID: when a backup is restored from a different device, tap this button to complete the operation.
Activating a license
Connect an external data storage device to the USB port of the device.
From the Home page, tap Configuration > Maintenance > License.
On the upper-right corner of the License page, tap Add. The following is displayed:

In the Step 1 box (Generate capability request), type the Activation Code. Then, tap Generate.
Generate gets active only after typing the Activation Code in the Step 1 box.
After tapping Generate, a capability request file is automatically stored in the external data storage device connected to the device.
The capability request file is correctly generated in the external data storage device connected to the device. Tap OK.
Disconnect the external data storage device from the USB port of the device.
Upload the capability request file on the license activation portal (https://atlascopco.flexnetoperations.com) for getting the capability response file.
After getting the capability response file, upload it on an external data storage device.
Connect the external data storage device to the USB port of the device.
In the License manager page (see “Step 3 – Acquire the capability response”), tap Upload.
In the Select capability response dialog box, tap the drop-down list.
Tap the correct capability response file. Then click Next.
In the Confirmation required dialog box, make sure that the capability response file has the requested license(s). Then, tap Upload for completing the process of license activation.
In the License page, after adding a license to the device, the Status of the license gets Active.
Backup
Insert the USB storage device into the USB port of the device.
In the Home page, tap Configuration > Maintenance > Backup.
If the USB storage device is not connect to the USB port of the device, the message External device not found is displayed.
Insert the USB storage device into the USB port of the device and continue the procedure.
At the end of the backup, the message Backup is finished is shown. Tap OK.
A file .zip is created on the USB storage device. In this file, all the data stored in the database and the photos are saved.
The backup file is protected by a password that is recognized by the device when the file is restored.
Restore
Insert the USB storage device into the USB port of the device.
In the Home page, tap Configuration > Maintenance > Restore.
If the USB storage device is not connect to the USB port of the device, the message External device not found is displayed.
Insert the USB storage device into the USB port of the device and continue the procedure.In the Select file for restore dialog box, select the backup file to restore. Then tap Next.
In the Confirmation required dialog box, tap OK.
After the restoring of the database the application will be closed.
In the Restore dialog box, tap OK when the restore is completed.
At the end of the restore of the database, the device switches off.Switch on the device. From the Home page tap Configuration > Maintenance > License, then tap on the Reset ID button.
The application can now be used with the restored database.
The restore is run only if the battery level of the STpad is greater than 50%, or the device is connected to the power supply.
It is not possible to restore the backup of a database version 04.00 on previous versions of the application.
It is not possible to restore the STpad backup on the STpalm and vice versa.
Logging configuration
In the Home page, tap Configuration > Maintenance > Logging.
From the drop-down list of the API Log level, Open Protocol Log level and Device Log level, select between:
warning
info
verbose
debug
trace
By default the log levels are set to info.
From the Infrastructure Logging drop-down list, select between:
on
off
By default set to off.
Then, tap Save.
Exporting application logs
Insert the USB storage device into the USB port of the device.
In the Home page, tap Configuration > Maintenance > Export logs.
If the USB storage device is not connected to the USB port of the device, the message External device not found is displayed.
Insert the USB storage device into the USB port of the device and continue the procedure.
The logs files are exported on the USB storage device in a .zip file. Tap OK.
Remove the USB storage device from the USB port of the device.
Insert the USB storage device into the USB port of the PC.
Exporting STbench logs
Insert the USB storage device into the USB port of the device.
In the Home page, tap Configuration > Maintenance > Export STbench logs.
If the USB storage device is not connected to the USB port of the device, the message External device not found is displayed.
Insert the USB storage device into the USB port of the device and continue the procedure.
The logs files (max 10) are exported on the USB storage device in a .zip file. Tap OK.
Remove the USB storage device from the USB port of the device.
Insert the USB storage device into the USB port of the PC.
Export STbench dumps
Insert the USB storage device into the USB port of the device.
In the Home page, tap Configuration > Maintenance > Export STbench dumps.
If the USB storage device is not connected to the USB port of the device, the message External device not found is displayed.
Insert the USB storage device into the USB port of the device and continue the procedure.
The dump files are exported on the USB storage device in a .zip file. Tap OK.
Remove the USB storage device from the USB port of the device.
Insert the USB storage device into the USB port of the PC.
Export all
To export the backup, the application logs, the STbench logs and dumps at once:
Insert the USB storage device into the USB port of the device.
In the Home page, tap Configuration > Maintenance > Export all.
If the USB storage device is not connected to the USB port of the device, the message External device not found is displayed.
Insert the USB storage device into the USB port of the device and continue the procedure.
The files are exported on the USB storage device in a .zip file. Tap OK.
Remove the USB storage device from the USB port of the device.
Insert the USB storage device into the USB port of the PC.
Isolated mode
The Isolated mode is an internal Service test intended to verify the calibration of the brake(s) of the STbench.
In Isolated mode, the device does not store the results in the memory and does not generate any statistics. In order to perform this test properly, the calibration equipment is necessary.
In the Home page, select Isolated mode between the available features.
The following is displayed:

Doing a test
In case of STpad, make sure that the STbench is connected to the device (for more information, see “Measuring Devices”).
In the Home page, tap Isolated mode > Torque. The following is displayed:
In the Select transducer window, select the transducer to use during the test.
The following Torque page is automatically displayed:
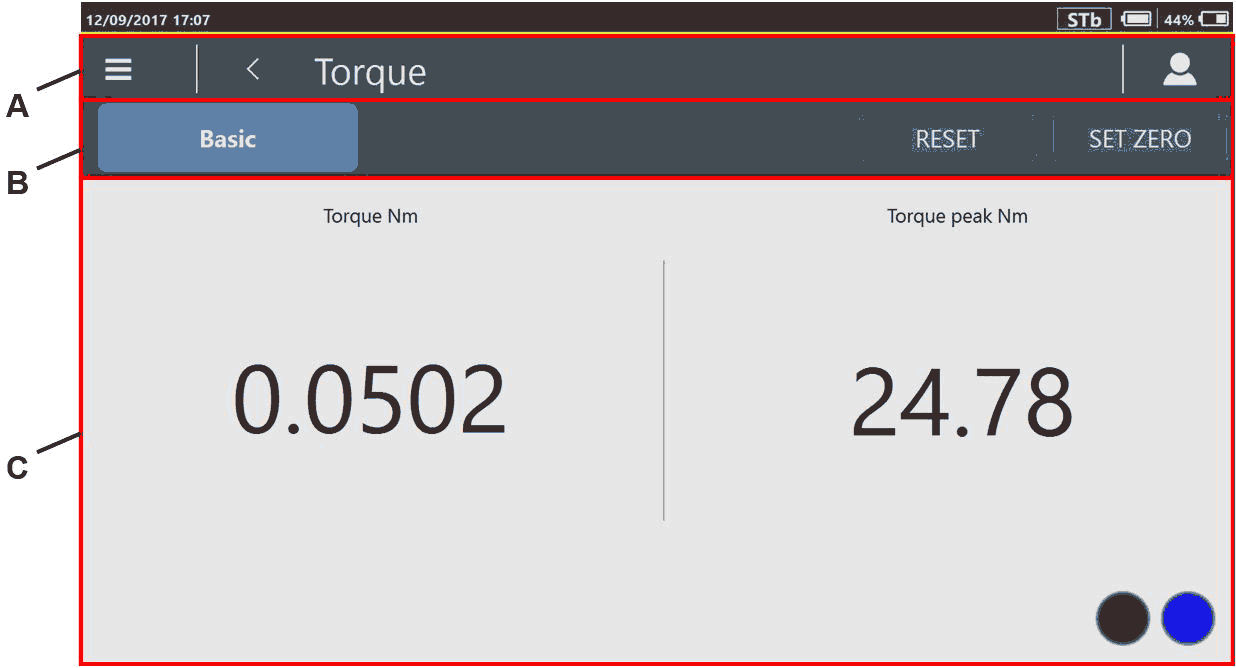
B
Reset / Set Zero
C
Results section
To set the Torque peak value to 0 N·m, tap Reset.
To set the measured Torque value as reference point, Tap Set zero.
The Free track test result section is as follows:
Torque (N·m): torque measured during the free track test.
Torque peak (N·m): torque peak measured during the free track test.
 : the STbench is ready for a new result.
 : the STbench is working (it is either doing a result or sending a trace).
Apply torque either clockwise or counterclockwise. Torque applied in counterclockwise direction gives negative torque values.
References
SPC results, limits and rules
Below are the possible results that summarize the SPC test:
Icon | Tool application | Diagnosis | Further action |
| Can be used | The tool works correctly. | None |
| Can be used | The average is higher than the upper control limit, but it does not exceed the upper tolerance limit. | Calibrate: decrease the torque |
| Can be used | The average is lower than the lower control limit, but it does not fall under the lower tolerance limit. | Calibrate: increase the torque |
| Can be used | Excessive dispersion of the values prevents proper calibration of the tool, but the measured values are still within the tolerance limits. | Repair |
| CANNOT be used | At least one value is higher than the tolerance limit. | Remove the tool from the production line and calibrate: decrease the torque |
| CANNOT be used | At least one value is lower than the tolerance limit. | Remove the tool from the production line and calibrate: increase the torque |
| CANNOT be used | Some measured values are out of tolerance limits. Excessive dispersion of the values PREVENTS proper calibration of the tool. | Remove the tool from the production line and repair |


The SPC Rules give the results listed in the above table.
Below are the SPC test limits:
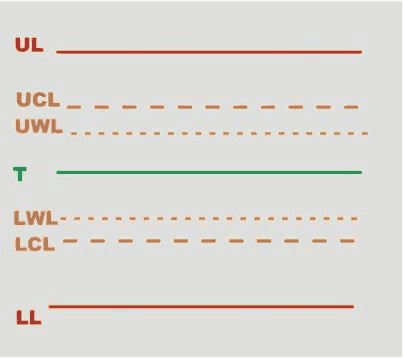
UL | Upper Limit | LWL | Lower Warning Limit |
UCL | Upper Control Limit | LCL | Lower Control Limit |
UWL | Upper Warning Limit | LL | Lower Limit |
T | Target (nominal) |
Upper Limit (UL) and Lower Limit (LL) are the SPC test limits.
The SPC test limits are calculated as follows:
Upper Control Limit (UCL) = ((UL + LL) / 2) + (A · ((UL - LL) / 6))
Lower Control Limit (LCL) = ((UL + LL) / 2) - (A · ((UL - LL) / 6))
Upper Warning Limit (UWL) = ((UL + LL) / 2) + (2/3 · (UCL - ((UL + LL) / 2)))
Lower Warning Limit (LWL) = ((UL + LL) / 2) - (2/3 · (((UL + LL) / 2) - LCL))
Range = D2 · ((UL - LL) / 6)
A and D2 are coefficients that depend on the number of the SPC tests:
Number of SPC tests | A | D2 |
|---|---|---|
1 | 0.000 | 0.000 |
2 | 2.121 | 3.686 |
3 | 1.732 | 4.358 |
4 | 1.500 | 4.698 |
5 | 1.342 | 4.918 |
6 | 1.225 | 5.078 |
7 | 1.134 | 5.204 |
8 | 1.061 | 5.306 |
9 | 1.000 | 5.393 |
10 | 0.949 | 5.469 |
11 | 0.905 | 5.535 |
12 | 0.866 | 5.594 |
13 | 0.832 | 5.647 |
14 | 0.802 | 5.696 |
15 | 0.775 | 5.741 |
16 | 0.750 | 5.782 |
17 | 0.728 | 5.820 |
18 | 0.707 | 5.856 |
19 | 0.688 | 5.891 |
20 | 0.671 | 5.921 |
21 | 0.655 | 5.951 |
22 | 0.640 | 5.979 |
23 | 0.626 | 6.006 |
24 | 0.612 | 6.031 |
25 | 0.600 | 6.056 |
Below are the rules applied to the last set of number of samples performed during a SPC test:
RULE 1 – The last average is outside the control limits
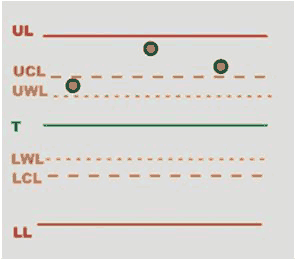 |
|  |
|
RULE 6 – The dispersion is too large
 |
|  |
| |
Dispersion is too big if it is greater than the range.
RULE 7 – At least one value outside the tolerance limits
 |
| 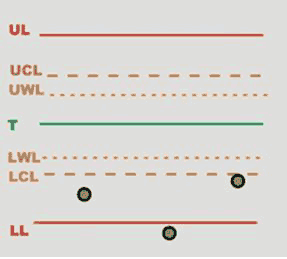 |
|
RULE 8 - The dispersion is larger than the warning limit
 |
| 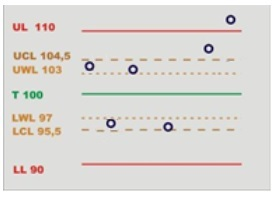 |
| |
Below are the rules applied to the last averages related to the set of number of samples performed during a SPC test.
The device stores the last seven averages to analyze the trend according to the following rules:
RULE 3 – The last 7 averages are over or under the nominal value
 |
| 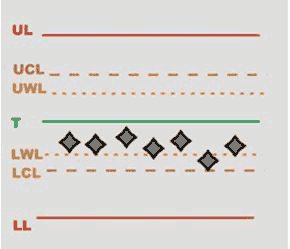 |
|
RULE 4 - The last 7 averages are increasing or decreasing
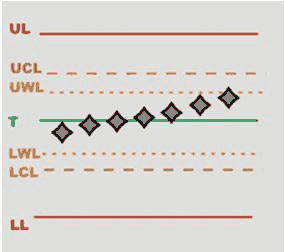 |
|  |
|
RULE 5 - The last 2 averages are outside the warning limits
 |
|  |
|
RULE 2 - The last 4 averages are outside 1/3 of the control limits
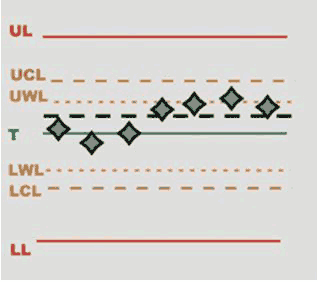 |
|  |
|
Tool types
The available tool types are:
Peak wrench: hand-operated tools, defined as displaying torque wrench (type I) in the ISO 6789 standard
Click wrench: hand-operated tools, defined as breakaway torque wrench (type II) in the ISO 6789 standard
Power tool: continuously rotating tool that provides real torque to the joint, like battery tools, pneumatic tools (not impulse) and electronic controlled tools
Pulse tool: tool that provides a series of pulses to tighten the joint.
Tool check testing
In the following a description of the parameters that characterized the strategies available for the tool testing.
Click strategy
Click strategy
This strategy is applicable to a click wrench with breakaway technology with one breakaway point, defined as setting torque tools (type II and class A, C, G, B by standard ISO 6789)
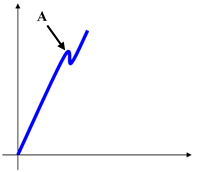
A | Click point |
The click-point is detected when the torque drops and then increases again, as shown in the two following examples:
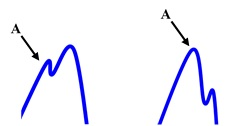
A | Click point |
If the torque drops to zero without increasing again after a peak point, the peak point is not detected as click point. For this reason, slip-wrenches cannot be tested with this method (the slip-wrenches should be tested with the Peak Wrench or Cam-over strategies):
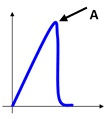
A | Point not detected as click point |
If the test ends and the click-point is not detected, a message Not detected is shown at the bottom-left area of the display. In that case the result is the torque absolute peak.
The parameters that characterize the click point detections are:
Measure delay time: this timeout is used to filter the possible spikes or noise at low torque values. When the torque reaches the Cycle Start value, the timer starts. During this time the torque trace is not analyzed and the click point is not searched.
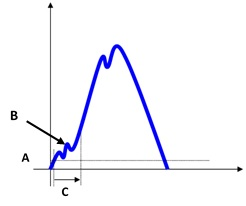
Torque vs time A
Cycle start
B
Ignored point
C
Measure delay time
Reset time: this timeout is used to filter the possible spikes/bounces after the click-point. When the torque goes below the cycle complete value, the timer starts. During this time the torque trace is not analyzed (any click-point possibly occurring during the reset time is not considered). This timeout can be used when the click-wrench produces such spikes-bounces after the click-point.
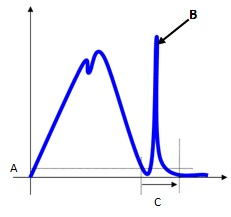
A
Cycle complete
B
Ignored point
C
Reset time
End cycle time: this timeout defines the end of the test. When the torque goes and remains below the Cycle Complete for the given timeout, the test ends. The test ends when torque remains under the cycle complete load for the timeout (torque during the reset time is ignored).
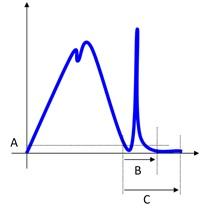
Torque vs time A
Cycle complete
B
Reset time
C
End cycle time
Slip Torque: The slip torque gives the requested drop in torque after the click-point. If the torque drops more than the slip torque, the peak value is considered as click-point; if not, the peak value is ignored.
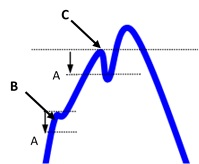
A
Slip torque
B
Torque drops less than the slip torque → the peak is ignored
C
Torque drops more than the slip torque → the peak is a click-point result
However, it is possible to give the slip torque manually. This option is useful in case the click-point is not detected when the slip torque is set to Automatic. In this case do the following procedure: do some tests and make an analysis by looking at the traces. Then, select the proper value in order to detect the click-point.
Suggestions: Setting this value too low increases the risk of detecting a false click-point, while setting this value too high increases the risk of not detecting the real click-point. The best trade-off can be figured out only looking at the characteristics of the specific click-wrench under test.
Cam-over strategy
This strategy is applicable to a wrench or screwdriver with clutch technology that "slips-free" when the set torque is reached, preventing under and over tightening.
The click wrenches with clutch technology are defined as setting torque tools (Type II by standard ISO 6789).
The slip-wrench test provides the maximum torque measured during the test.
The parameter that characterize the peak point detections is:
End cycle time: it defines the end of the test. When the torque goes and remains below the transducer minimum load (which is normally the 5% of the transducer full scale) for the given timeout, the test ends.
If the torque goes over transducer minimum load before the timeout, the test continues. The test ends when torque remains under the transducer minimum load for the timeout.
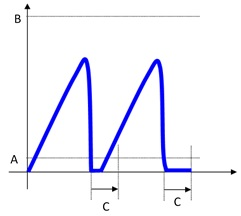
Torque vs time A
Transducer min load
B
Transducer full scale
C
Timeout
Peak strategy
This strategy is applicable to a peak wrench, defined as indicating torque tools (type I by standard ISO 6789).
The peak wrench test provides the maximum torque measured during the test.
The parameters that characterize the peak point detections are:
End cycle time: it defines the end of the test. When the torque goes and remains below the transducer minimum load (usually 5% of the transducer full scale) for the given timeout, the test ends.
If torque goes over transducer minimum load before the timeout, the test continues. The test ends when torque remains under the transducer minimum load for the timeout.Torque vs time A
Transducer min load
B
Transducer full scale
C
End cycle time
Relaxation time + End cycle time: due to the mechanical relaxation of the wrench, the torque peak detected by the wrench slightly decreases after a short time interval. The relaxation time allows to adjust the peak detection in case of wrenches that do not save the torque peak, thus reducing discrepancies between the transducer and the wrench torque peak detections. If Relaxation time > 0, the End cycle time starts when the Relaxation time expires.
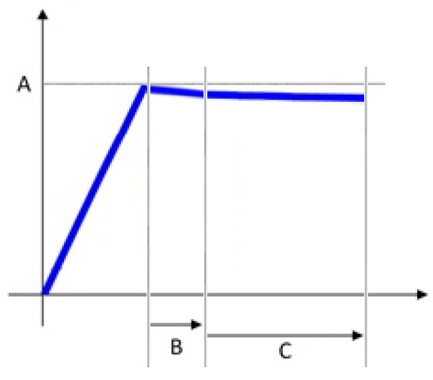
Torque vs time A
Torque peak
B
Relaxation time
C
End cycle time
Direct driven strategy
For power tool test, the torque result is the peak value measured during the test.
In case of multiple peaks, the result is the highest peak.
Testing the tool with a torque/angle transducer makes possible to define a torque/angle window in which the result is OK.
The parameter that characterize the peak point detections are:
Measure delay time: this timeout is used to filter the possible spikes or noise at the beginning of the test. When the torque reaches the Cycle Start value, the timer starts. During this time the torque trace is not considered.
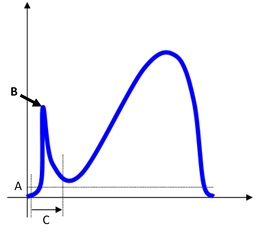
Torque vs time A
Cycle start
B
Ignored point
C
Measure delay time
Reset time: this timeout is used to filter the possible spikes/bounces after the tool clutch release the torque. When the torque goes below the cycle complete value, the timer starts. During this time the torque trace is not considered.
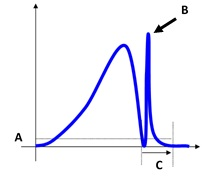
Torque vs time A
Cycle start
B
Ignored point
C
Reset time
This timeout can be used in those cases where the power tool produces such spikes-bounces at the end of the test.
End cycle time: this timeout defines the end of the test. When the torque goes and remains below the Cycle Complete for the given timeout, the test ends.
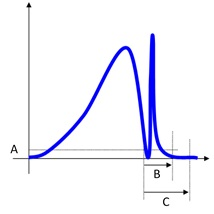
Torque vs time A
Cycle complete
B
Reset time
C
End cycle time
The Cycle Complete must be equal or less than the Cycle Start. The value of the End cycle time must be equal or greater than the Reset time value.
Measure angle from
Below an example of a complete curve in which the measurement of the angle starts as soon as the torque reading starts, to be compared with the curves representing the angle measured from One step/Second step/Starting second step:
A | Torque [Nm] | B | Angle [°] |
C | Time [ms] |
One step: the measurement of the angle starts as soon as the Final monitoring torque value is reached.
A | Torque [Nm] | B | Angle [°] |
C | Time [ms] |
Second step: the measurement of the angle starts in the second step, when the Final angle monitoring torque value is reached.
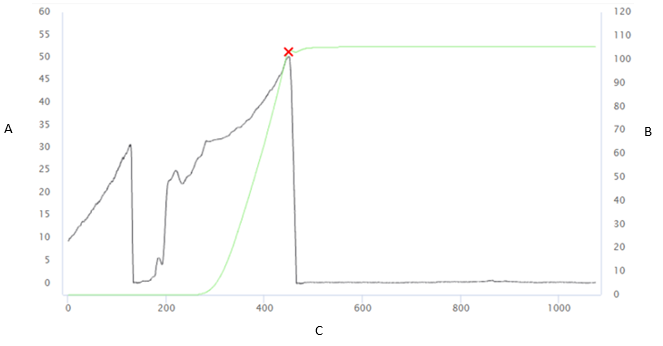
A | Torque [Nm] | B | Angle [°] |
C | Time [ms] |
Starting second step: the measurement of the angle starts at the starting of the second step.
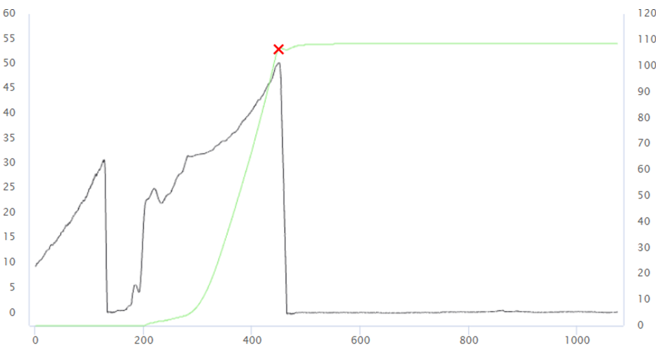
A | Torque [Nm] | B | Angle [°] |
C | Time [ms] |
Only angle strategy
This strategy is available for the power tools.
It is possible to make a specific test to verify the angle of a tool.
Suggestion: In this case the Final angle monitoring torque defines the torque value from which the angle is measured. Leave it to zero to measure the angle without applying any torque.
Pulse strategy
To calculate the tool frequency, the Pulse Tool strategy uses a configurable threshold to identify a peak.
The parameter that characterize the peak point detections are:
End cycle time: when the torque goes and remains below the transducer minimum load (which is normally the 5% of the transducer full scale) for the given time, the test ends.
Timeout can be set from 0.1 s up to 5 s. The default value is 0.4 s.
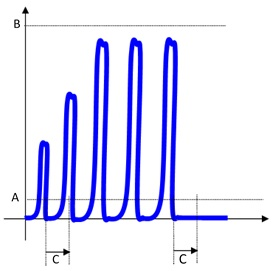
Torque vs time A
Transducer min load
B
Transducer full scale
C
End cycle time
Torque coefficient: Pulse tools do not provide a continuous torque output, but they generate single high energy pulses of very short duration (» 1ms). This series of pulses results in the tightening of a joint. Due to the physics of the tool the final torque reached cannot be measured directly as for real torque tools. The reason for this is that pulse tools provide a very high torque for such a short time that only a part of these peaks translates into the tightening of the joint (generating more clamping force). This depends on many factors such as the bolt mass, friction, the stiffness of the joint, etc... The torque coefficient can be used to align the torque measured by the transducer with the real torque produced on the joint. The torque produced on the real joint will be always smaller (ideally equal) than the peak torque measured on the transducer. Therefore, this coefficient can be set to values between 0.1 and 10.
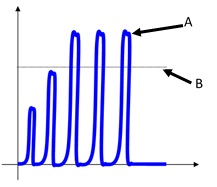
Torque vs time A
Peak value measured on the torque transducer
B
Actual torque measured on the joint
The only way to evaluate the actual torque is to make a residual torque check on the real joint (for instance, by using a STwrench). The relation between the peak torque measured on the transducer and the actual torque on the joint is affected by all the components: The pulse tool, the adapters, the transducer and the joint itself. If any of these components is changed, the relation peak torque – actual torque should be recalculated.
The following process should be used to adjust the pulse tool in order to provide the desired torque on the real joint and to calculate the proper coefficient K:
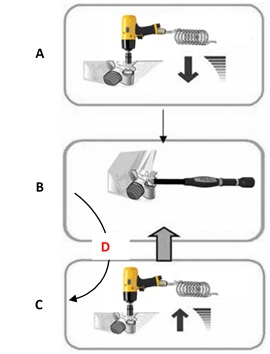
A
Set a value torque
B
Check the residual torque
C
Slightly increase torque
D
Too low
For instance, assume a target torque for the joint of 100 Nm, and after the tool regulation the residual torque check gives 100 Nm; if the torque measured on the transducer is 120 Nm, in that case the coefficient is 100/120 = 0.83.
Threshold: it is used to filter the trace for proper peak detection for the frequency calculation. After each peak is detected, all the values under the threshold are discarded. This filters all the bounces always present in a pulse tightening.
The threshold can be set from 1 to 99 %. The default value is 80%.
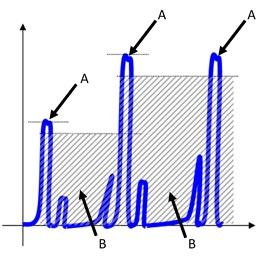
Torque vs time A
Peak
B
Bounce
ACTA pulse strategy
To calculate the tool frequency, the ACTA Pulse Tool strategy uses a set of timers and recalculates the Cycle Start dynamically each time a peak is measured (the Cycle Start is set to the last peak value divided by 1.5).
The parameters that characterize the ACTA pulse strategy are:
Measure delay time: when the torque goes over the cycle start value, the torque is ignored during this Measure delay time. This can be helpful to exclude noise and “false pulses” at the low torque values. The timeout can be set from 0 s up to 5 s. The default value is 0 s (no delay applied).
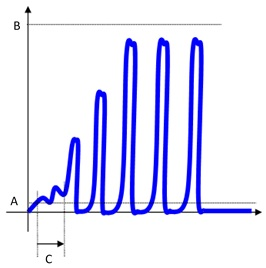
Torque vs time A
Cycle start
B
Transducer full scale
C
Measure delay time
Reset time: after each peak, the reset time defines a time during which the STa 6000 / STa 6000 Plus does not consider the torque trace. This can be helpful in order to avoid considering as two real peaks the real peak and the bounces possibly produced by the peak itself.
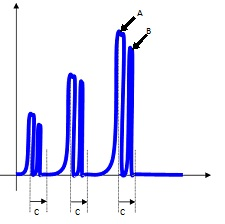
Torque vs time A
Peak
B
Bounce
C
Reset time
The value of this parameter depends on the frequency of the pulse tool and on the bounces possibly present in the trace. The timeout can be set from 0 s up to 5 s. The default value is 0 s (no reset time applied).
End cycle time: when the torque goes and remains below the Cycle complete for the end cycle time, the test ends.
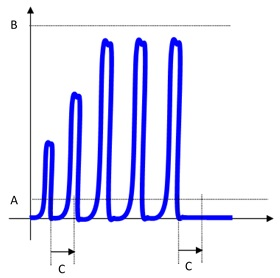
Torque vs time A
Cycle complete
B
Transducer full scale
C
End cycle time
Joints check testing
The quality control strategies are used to check tightening operations already performed, by executing the residual torque check operation.
In the following a description of different strategies.
Residual Torque/Angle
This strategy evaluates the residual torque on a joint, looking for the residual point of the Torque / Angle trace.
A | Cycle start | B | Minimum torque |
C | Maximum torque | D | Breakaway = Residual |
A | Cycle start | B | Minimum torque |
C | Maximum torque | D | Breakaway |
E | Residual |
Define the torque limits such that the residual point is OK in the result.
The Final angle monitoring torque, which must be greater than the Cycle start, defines the point from which the device algorithm starts analyzing the torque/angle trace. This is useful to filter all the noise that may occur at low torque value, and that could be detected as a false residual point.
Torque result:
If the residual point is detected, the result is associated with the residual point; the test is OK if the residual falls within the limits.
If the residual is not detected or the torque goes over the maximum torque, the torque result is the maximum value. Therefore, if the maximum value falls within the limits, the torque result is still OK, but the overall result is marked as Not OK.
If the torque goes over the Change Screw value, the residual is no longer detected and the torque result is the maximum torque.
In the configuration of the residual torque/angle strategy, there are two advanced parameters:
Breakaway angle threshold: it specifies the maximum angle for the residual torque (measured from the Final angle monitoring torque).
Residual angle threshold: it specifies the maximum angle (measured from the Final angle monitoring torque) for the residual torque when a the residual torque is lower than the breakaway point.
If the residual point precedes the Residual angle threshold, the residual torque is detected. this is the normal condition for a residual torque test.
If the residual point is over the Residual angle threshold, the breakaway point is the result of the test. In this case, the Residual angle threshold should be increased to detect the proper residual point.
If the breakaway point is over the Breakaway angle threshold, the residual point is not detected even if the residual point precedes the Residual angle threshold
Residual Torque/Peak
This strategy evaluates the residual torque on a joint as the peak torque necessary to rotate the screw further.
With this strategy, the breakaway point is not detected automatically. Therefore, this is a less objective method of evaluating residual torque. It may be used when the residual torque/time or torque/angle methods cannot be performed.
A | Minimum torque | B | Maximum torque |
C | Torque peak |
Specify the torque limits in order to get a result “OK”.
If the Target Angle is not specified, the angle result is marked as Not Applicable.
If a Target Angle value is specified, the residual torque result is measured at the specified angle (starting from the Final angle monitoring torque) instead of the peak torque:
A | Minimum torque | B | Maximum torque |
C | Target angle |
Strategies parameters
In the following a list of the parameters for each strategy:
Direct driven
Free rounds
Cycle start
Cycle complete
Final angle monitoring torque
Filter frequency
Measure torque at
Measure delay time
Reset time
End cycle time
Only angle
Filter frequency
Final angle monitoring torque
End cycle time
Peak
Filter frequency
Cycle start
Final angle monitoring torque
Relaxation time
End cycle time
Click
Cycle start
Cycle complete
Filter frequency
Slip torque
Measure delay time
Reset time
End cycle time
Cam-over
Filter frequency
Cycle start
End cycle time
Pulse
Cycle start
Filter frequency
Torque coefficient
Torque threshold
Minimum pulse
Maximum pulse
End cycle time
ACTA Pulse
Cycle start
Cycle complete
Filter frequency
Minimum pulse
Maximum pulse
Measure delay time
Reset time
End cycle time
Residual torque/angle
Cycle start
Ratchet time
Change screw
Final angle monitoring torque
Residual angle threshold
Breakaway angle threshold
Torque correction coefficient
Angle correction coefficient
Residual torque/peak
Cycle start
Ratchet time
Change screw
Final angle monitoring torque
Torque correction coefficient
Angle correction coefficient
Traceability tag
The traceability tag allows to link additional information to a test and they are collected by the operator.
There are several levels where the traceability tag can be required (route, subgroup, inspection, piece/part and sample), three sources from which the information are acquired (barcode, keyboard and picklist), and the possibility to enable the traceability tag request when a test not completed is resumed.
The Traceability tag of subgroup level are not supported in this version.
If the system is upgraded, the subgroup level traceability tag becomes route level traceability tag.
The traceability tag of piece/part level is available only for By part inspections.
In the following, some examples of possible use of the traceability tag.
Example 1
The traceability tag is configured in the following parameters:
Level: route.
Source: barcode.
Collection point: before.
Operations:
Configure a route with more than one inspection.
Start the route.
Select the inspection.
The barcode is required.
Scan of the barcode.
Complete the route.
If the route is repeated without exit the route page, the barcode is not required a second time.
The barcode is required only at the beginning of the first inspection of the route.
Example 2
The traceability tag is configured in the following parameters:
Level: inspection.
Source: picklist.
Collection point: after.
Operations:
Configure a route with two inspections.
Start the route.
Select the inspection.
Do the test.
After the first result of the inspection, select a tag from the picklist.
Complete the inspection.
Select another inspection.
Do the test.
After the first result of the inspection, select a tag from the picklist.
Complete the inspection.
Example 3
The traceability tag is configured in the following parameters:
Level: part (piece).
Source: barcode.
Collection point: before.
Operations:
Start the route.
Select the enabled inspection.
Before the first result, the barcode is required.
Scan the barcode, so that the first part (piece) is linked to the tag.
The first test point of all the other inspections are done without tag request.
Before the second result of the first inspection is done, the barcode is required.
Scan the barcode.
The second test point of all the other inspections are done without tag request.
This process is repeated for a number of times equal to the number of part (piece to test).
Example 4
The traceability tag is configured in the following parameters:
Level: sample.
Source: keyboard.
Collection point: after.
Operations:
Start the route.
Select an inspection.
At the end of each result, the input from the keyboard is required.
Maximum number of application items
Item | Maximum number |
|---|---|
Users | 100 |
Tools | 10000 |
Joints | 10000 |
Assembly parts | 10000 |
Attribute lists | 1000 |
Binary lists | 1000 |
Attribute list attributes | 50 |
Assignable cause lists | 1000 |
Assignable cause list entries | 50 |
Corrective actions lists | 1000 |
Corrective actions list entries | 50 |
Routes | 100 |
Inspections per route | 500 |
Inspections per tool | 60 |
Inspections per joint | 10 |
Inspections per assembly part | 50 |
Measuring devices | 100 |
Power tool controllers | 1000 |
Media items | 10000 |
Dimensional quantities | 50 |
Measurements | 50000 |
Requirements for raw traces files
The files imported as raw traces must meet the following requirements:
The file formats supported are *.qap and *.txt.
The file must contain at least 10 lines.
The file must contain the following three columns: time (ms), torque (Nm), angle (°).
The separator of decimal places must be a comma or a period.
The separator of thousands is not allowed.
Each line of the file must contain at least 3 numerical values.
Values must be separated by a semicolon or a tab.
The maximum number of lines in a file is 50000.
The file must be UTF8 or ASCII and must not start with the Byte Order Mark (BOM).
Possible blank lines are ignored.
Below an example of the content of a file:
0;2.505;0.35
200;4.519;10.35
400;5.534;20.70
600;6.546;30.70
800;7.055;40.05
1000;7.363;50.05
1200;7.457;60.40
1400;7.483;70.40
1600;7.096;80.75
1800;2.608;90.75
Glossary
Parameter | Definition |
|---|---|
Angle correction | When the joint design or space limitations preclude use of standard sockets or tools, it may be necessary to use special extension spanners to fit the application. When an extension is used, the angle correction constant permits linear compensation of extension torsion due to the torque applied. It is a fixed additive value. The value is expressed in degrees at the reference torque (Torque nominal). |
Batch size | This parameter specifies how many times the test must be executed. Inside an inspection, this is the number of results expected to complete the inspection. |
Breakaway threshold | It specifies the maximum angle for the residual torque (measured from the Start Final Angle). Over this angle the test result is marked as “not detected”. |
Change screw at | Over-torque threshold that generates an alarm during the test if passed. The alarm notify to the operator that the over-torque applied has damaged the screw. The screw replacement is recommended. This must be higher than the Final Torque max value. |
Cm index | The Cm index describes machine capability; it is the number of times the spread of the machine fits into the tolerance width. The higher the value of Cm, the better the machine. |
Cmk index | The Cmk index describes the capability corrected for position. It is not much use having a high Cm index if the machine setting is way off center in relation to the middle of the tolerance range. A high Cmk index means, then, that you have a good machine with a small spread in relation to the tolerance width, and also that it is well centered within that width. If Cmk is equal to Cm, the machine is set to produce exactly in the middle of the tolerance range. |
Cp index | The Cp index describes process capability; it is the number of times the spread of the process fits into the tolerance width. The higher the value of Cp, the better the process. |
Cpk index | The Cpk index describes the process capability corrected for position. It is not much use having a high Cp index if the process setting is way off center in relation to the middle of the tolerance range. A high Cpk index means, then, that you have a good process with a small spread in relation to the tolerance width, and also that it is well centered within that width. If Cpk is equal to Cp, the process is set to produce exactly in the middle of the tolerance range. |
Cycle complete | When the torque goes and remains under this value for longer than the End cycle time parameter, the test ends (click wrench). |
Cycle start | Torque value from which to start the torque measurement. This must be higher than the transducer Minimum Load value. |
End cycle time | This timeout defines the end of the test. |
Filter frequency | Filtering is a digital operation done on the torque values in order to reject measurement noise and to improve the quality of the measurement results. The filter frequency is a value that gives an indication of what the data collector “ignores” from the process it is monitoring. This value should be chosen carefully: a value that is too small (for example 10 Hz) produces a not correct result for the fast tests made on power Tools. On the other hand, a value that is too large (1000 Hz) can be responsible for noisy traces and results. |
Final angle monitoring torque | For control strategies involving angle measurement, it specifies the torque value from which the angle measurement starts. |
Free round | Free rounds before starting the braking; used for some screwdrivers requiring a number of free rounds to reach the proper operating speed before starting the test operation. |
Friction coefficient | Dimensionless scalar value which describes the ratio of the friction force between two bodies and the force pressing them together. The coefficient of friction depends on the materials used. |
Measure delay time | This timeout is used to filter the possible spikes or noise at the beginning of the test. When the torque reaches the Cycle Start value, the timer starts. During this interval the torque is not considered. |
Measure torque at | Point at which the torque value is measured. The two options are: torque peak or angle peak. It defines which value to acquire on the curve as torque result, if on the local max torque or angle at the end of the curve. |
Minimum pulse | Minimum pulse to calculate the Cm-Cmk related to the number of pulses per second. |
Maximum pulse | Maximum pulse to calculate the Cm-Cmk related to the number of pulses per second. |
Ratchet time | Applied instead of the End cycle time when the torque goes below the cycle start but has not yet reached the Minimum torque value. This allows the operator to release the torque for a while and recharge during the test operation. |
Relaxation time | Due to the mechanical relaxation of the wrench, the torque peak detected by the wrench slightly decreases after a short time interval. This parameter allows to adjust the peak detection in case of wrenches that do not save the torque peak, thus reducing discrepancies between the transducer and the wrench torque peak detections. |
Reset time | This timeout is used to filter the possible spikes/bounces after the click-point. When the torque goes below the cycle complete value, the timer starts. During this time the torque trace is not analyzed (any click-point possibly occurring during the reset time is not considered). |
Residual angle threshold | It specifies the maximum angle (measured from the Start Final Angle) for the residual torque when a the residual torque is lower than the breakaway point. |
Slip torque | The slip torque gives the requested drop in torque after the click-point. If the torque drops more than the slip torque, the peak value is considered as click-point; if not, the peak value is ignored. |
Subgroup size | This parameter defines the number of tests (subgroup) necessary to define each point (the average value of the tests in the subgroup) of the SPC charts. |
Subgroup frequency | SPC, the points shown on the X-R chart are the averages of the set of tests defined in the Subgroup size parameter. The Subgroup Frequency parameter defines the frequency of the points considered in the chart and in the SPC rules:
|
Torque correction coefficient | When the joint design or space limitations preclude use of standard sockets or tools, it may be necessary to use special extension spanners to fit the application. In these cases, the wrench measure must be adequately compensated because the factory calibration is made for the standard arm and the extension arm increases the measured torque. The angle measure is also affected by the extensions, due to its specific torsion when the torque is applied. |
Torque threshold | Limit of the torque value. |
Yield point | Increasing a torque on a joint, this is the point at which the elastic behavior ends and the plastic elongation begins. |
Yield stress point | Theoretical point of stress (pressure) beyond which the material loses its elasticity and becomes permanently stretched. |
Reference documents
ISO 6789 - ISO 6789:2003 - Third edition 2003-04-01
ISO 6789 - ISO 6789-2:2017 - First edition 2017-02
ISO 5393 - ISO 5393:1994 - Second edition 1994-05-01
CNOMO - CNOMO E41.32.110N – CNOMO - July 1990
VDI/VDE 2645-2 - VDI/VDE 2645-2 - September 2014
JJF 1610-2017 - JJF 1610-2017 - May 2017