Summary for VDI/VDE 2465-2
At the end of the VDI/VDE 2465-2 test, the Summary category opens.
In the Summary category, tap Evaluate. Then the Data analysis - Test point opens.
In theTest for outliers page, the chart of the measured value is displayed. In the chart the following parameters are shown:
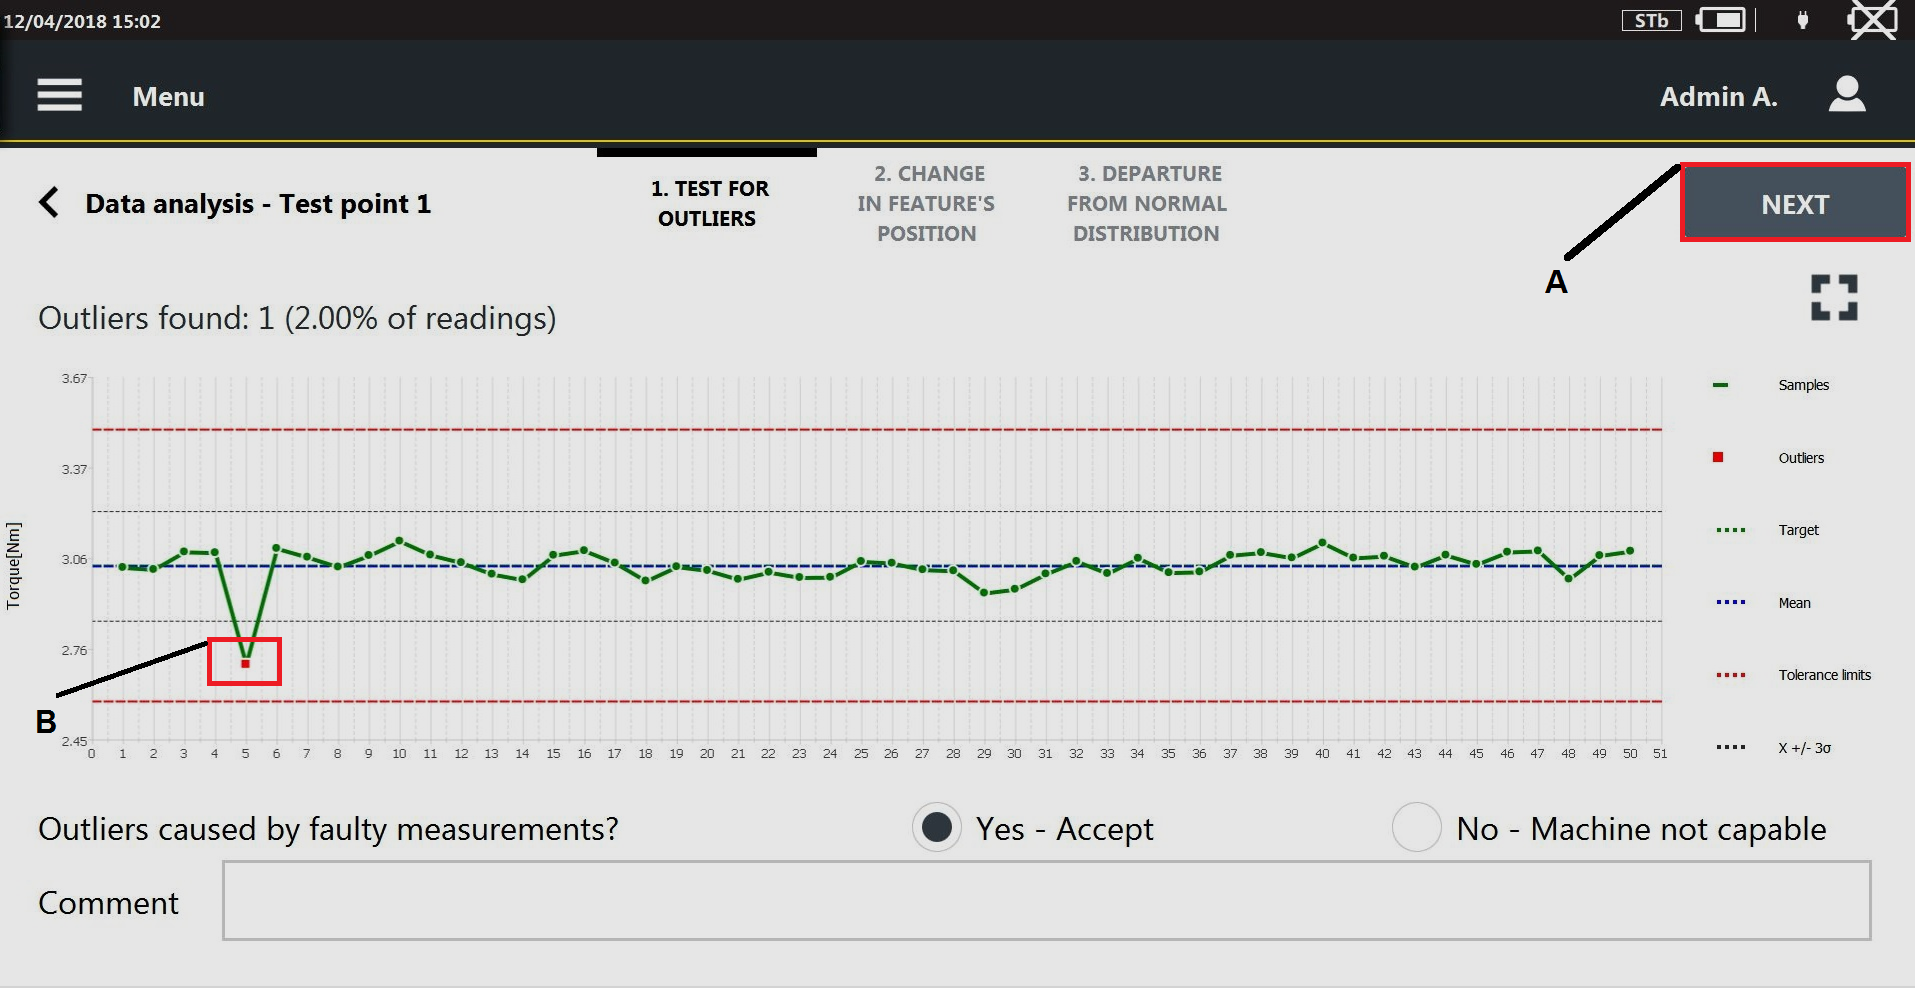
A
Next
2
Outlier
Target value
Mean value
Tolerance limit
Control limit (x ± 3σ)
If an outlier is detected, it is highlighted with a red point.
Under the chart, the following question is displayed: Outliers caused by faulty measurements?
Select Yes, if the outlier are not caused by a faulty measurements.
Select No, if the outlier is caused by a faulty measurements.
In Comment text box, it is possible to type a comment.
On the upper-right corner of the Data analysis page, tap Next.
In the Change in feature's position page, Changes detected indicates if the measured values are randomly distributed (Changes detected = No) or not (Changes detected = Yes).

A
Next
If the Change detected = Yes, the following question is displayed: Cause known and effect acceptable?
Select the Yes, if the cause of the not normality of the distribution is known.
Select the No, if the cause of the non-normality of the distribution is unknown.
In Comment text box, it is possible to type a comment.
On the upper-right corner of the Data analysis page, tap Next.
In the Departure from normal distribution page, the graph shows the histogram of the measure values and the fitting distribution. The parameter Normal distribution indicates if the measured values are distributed or not as a normal distribution.
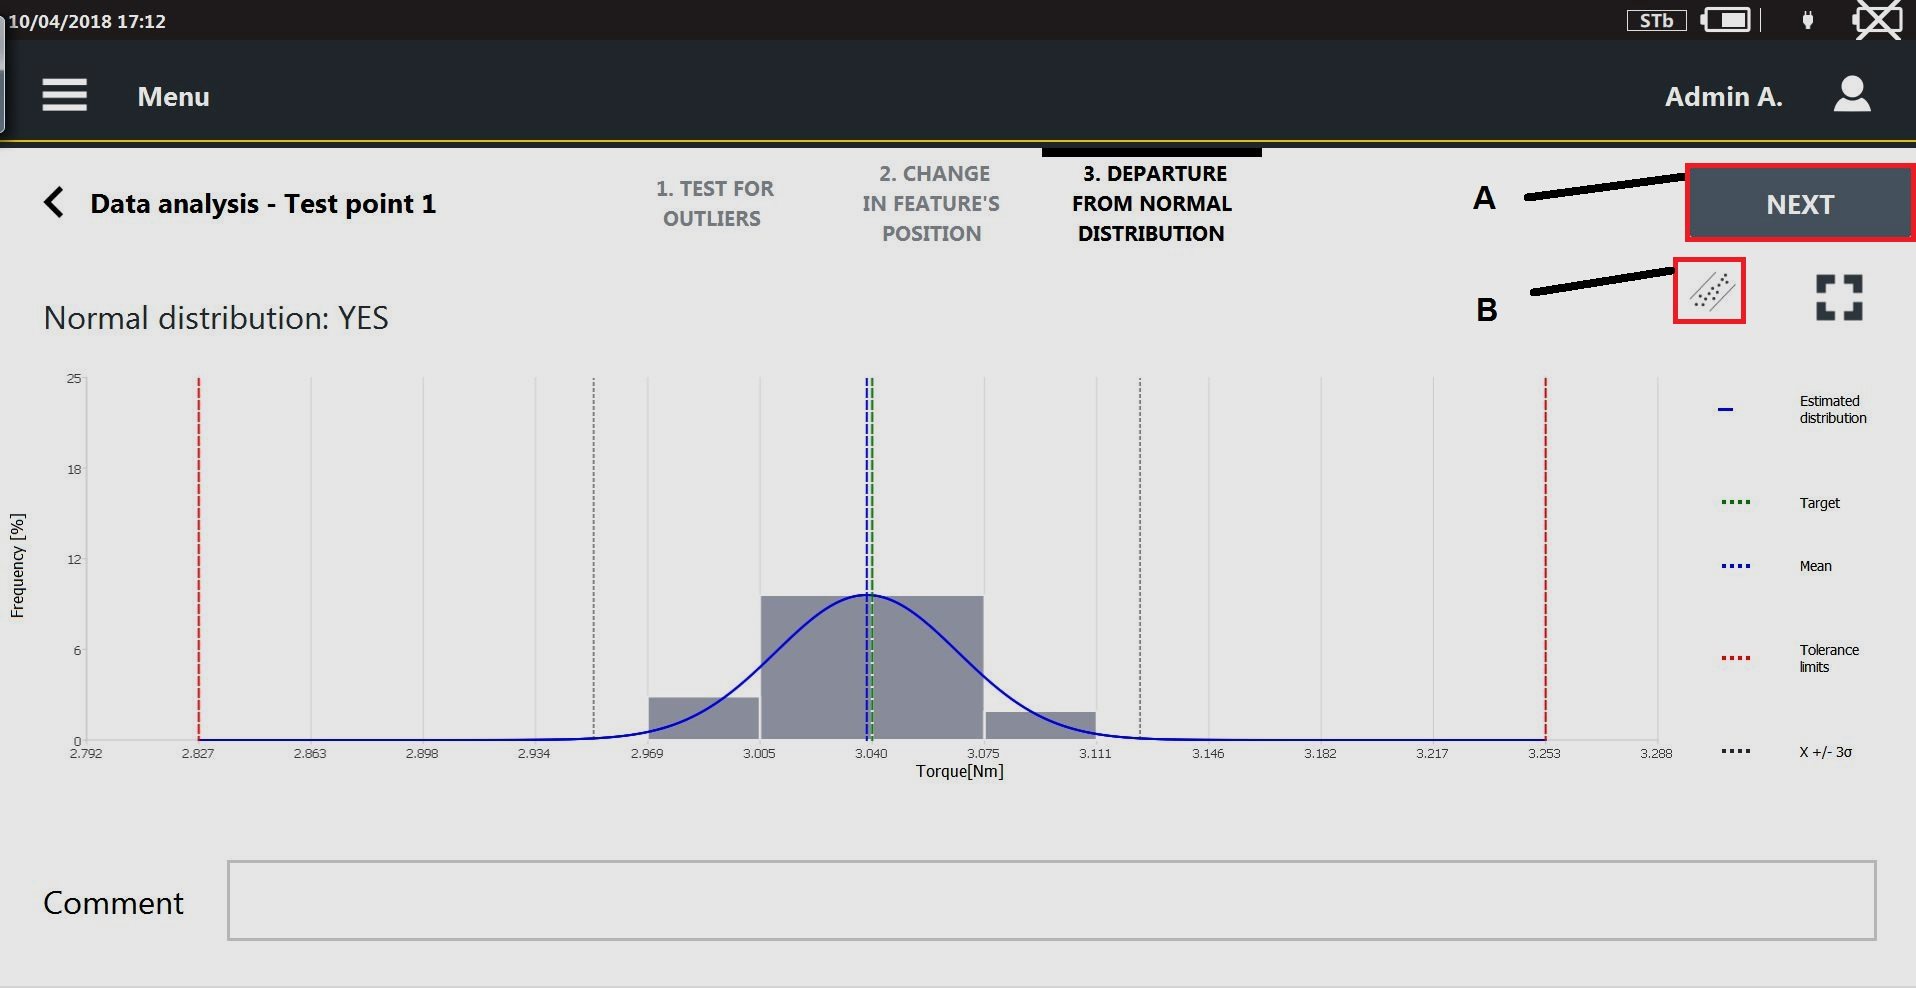
A
Next
B
Probability plot icon
If Normal distribution = Yes:
the fitting distribution is shown.
the mean value and the limits x± 3σ are shown.
If Normal distribution = No:
the fitting distribution is not shown.
the Xo/Xu and the median (X50%) values are displayed.
the following question is displayed: Cause known and effect acceptable?
Select the Yes, if the cause of the not normality of the distribution is known.
Select the No, if the cause of the not normality of the distribution is unknown.
In Comment text box, it is possible to type a comment.
On the upper-right corner of the Departure from normal distribution page, tap the Probability plot icon.
The Probability plot chart opens. The parameter Normal distribution indicates if the measured values are distributed or not as a normal distribution.

A
Next
On the upper-right corner of the Departure from normal distribution page, tap Next. Then tap Start to run the next test point.

Start is available only if the test result of the last test point done is OK.
To print the label at the end of the test: on the upper-right corner of the Summary category, tap Print label.
In the label, the following information are shown:
Tool ID
VDI 2645-2 standard applied
Location of the tool
Date of the last check
Date of the next check
Test result (OK/NOK)


