Trace category
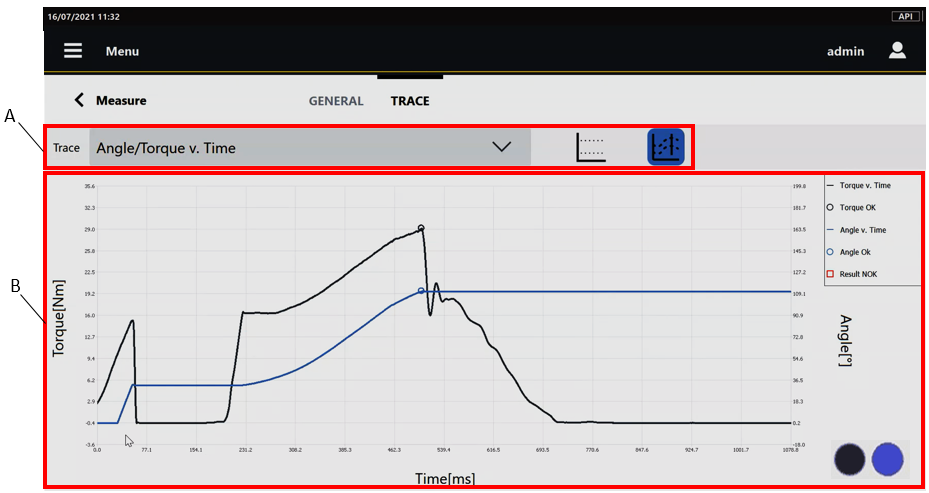
A | Trace toolbar | B | Trace with legend |
The Trace toolbar provides the following functionality:
Trace: select from the Trace drop-down box the plot to be displayed:
Torque v. time: torque-time plot of the last result.
Angle v. time: angle-time plot of the last result.
Angle/Torque v. Time: angle/torque-time plot are shown at the same time. A double vertical axis is shown on the chart.
Torque v. Angle: torque-angle plot of the last result.
Angle v. time, Angle/Torque v. Time and Torque v. Angle are available only in the following conditions:
The test runs on a brake.
The test runs on a transducer with angle measurement.
Limits: select the Limits button (
 ) to display the tolerance limits on the chart.
The graph shows the last result. After every new result, the trace shown is updated accordingly.
Angle trace from Cycle start: select the Angle trace from Cycle start button (
 ) to display the angle trace from the start of the test.
On the lower-right corner of the Trace category, the brake status indicator shows that the measuring device is ready for the test (blue indicator
 ), or that the measuring device is not ready for the test (red indicator
  ).
).
If the indicator is red, wait until the indicator turns blue before acquiring the next value.
If the Double result function is enabled on the STwrench and on the device, both the residual point and the peak point are shown on the plot.


