Working with the Results Tab
The tightening results are displayed in a condensed list that can be individually or collectively chosen to analyze further.
Select Show only NOK reslults at the bottom of each page to only view the results with NOK status.
Tightening Result
GUI part | Description |
|---|---|
Holding pin | Select the holding pin icon to pin the result to the pinned tab. |
Trace icon | Select the trace icon to view a graphical view of the results in the Trace workspace. |
Save icon | This command creates a zip-file with the result data. A pop-up dialogue window is opened to save the file at a desired location. |
Shunt calibration | Shows if shunt calibration is displayed. |
Overall Status | Total status of the tightening, OK or NOK. |
Type | |
Virtual station name | Name of the virtual station. |
Sync Mode Index and name | Index and name of the sync mode used in the tightening. |
Time Stamp | Time stamp for the tightening, that is, time and date. |

Channel Result
For each channel an overall result is reported with the following content:
GUI part | Description |
|---|---|
Trace | Select the trace icon to view a graphical view of the results in the Trace workspace. |
Save | This command creates a csv-file with the result data. A pop-up dialogue window is opened to save the file at a desired location. |
Bolt Name | The number and name of the bolt. Set in Sync Mode > “Name of the sync mode” > Bolt configuration > Bolt and Bolt name. |
Status | Total status of the tightening, OK or NOK. |
Status Info | Status information |
Program | The tightening program. Set in Tightening and Multistep Program > “Name of the tightening program” > Basic settings > Name. |
Channel | The channel number. |
Target Angle | The Target Angle will display the Target Angle value configured for the tightening strategy, which is used to perform the tightening. |
Final Angle | The actual measured angle of the last tightening step It is the Step Monitor Peak Angle located in the last tightening step that reports this parameter. |
Final Torque | Final Torque for the tightening. It is the Step Monitor Peak Torque located in the last tightening step that reports this Parameter. |
Target torque | Target torque. |
Elapsed time | Time from tightening start to end. |
Mode | Mode Name/Number |
Shunt calibration | Select this icon to display the shunt calibration data. |
Step Results
Each step in the multistep tightening program reports data. Most of this data is coming from the monitors and restrictions that are active during the step, so the data is only reported if a monitor or restriction of the correct type is configured.
Step Result Parameter | Description |
|---|---|
Step | The number of the step. |
Status | Status of the step, OK or NOK. |
Step type | Step type in the multistep program. |
Path | Indicates there in the program the step is located, that is, if it is in the tightening path or a repair or termination path. |
Peak torque (Nm) | Measured final torque including the torque induced during the internal break. Typically the peak torque is higher than the shut-off torque. |
Elapsed time | Time from tightening start to end. |
Angle |
|
Result Reporter
The list shows the values from the result reporters. If there is a result reporter defined for a program monitor/restriction, the value from that monitor/restriction is reported. If there is no result reporter defined for a program monitor/restriction, the value from the latest executed result reporter in main path will be reported.
Evaluation order if several reporters of the same type are defined in a program:
result reporter on program monitor/program restriction.
result reporter on monitor/restriction of the last executed step in main path.
Values on the highest level of the multistep result set by the corresponding result reporter:
final angle set by result reporter final angle
final torque set by result reporter final torque
current set by result reporter current
Trace
On a result click on the Trace icon if it is active.  . The result graph is displayed. It is possible to view several traces simultaneously by selecting several traces.
The Trace workspace shows detailed graphical information on one or several tightening result.
On the workspace, use the mouse wheel to zoom in or zoom out. Or you can select an area to zoom in. Double click the trace area to go back.
Examples:
Select an area to zoom in:
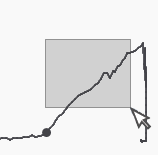
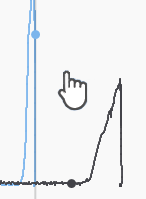
To move the trace, press the wheel button of the mouse:
In the trace graph, delta information based on the selected axis types can be displayed. Right click the two points you want to compare to show the delta between them. Drag the point to modify the target.
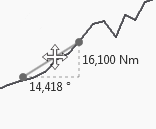
Drag the delta to move it or press Delete to delete it.
Trace settings | Description |
|---|---|
Limits | Check this box to show limits. If one curve is shown, limit values can be shown if they are used in the tightening program. |
Gridlines | Check this box to show the gridlines in the result graph. |
Min/Max | Show minimum or maximum measured value. |
|X-Axis| | Show the absolute value for X-axis. |
Y1 | Choose the information to be shown in the Y1-axis:
|
Y2 | Choose the information to be shown in the Y2-axis:
|
Y3 | Choose the information to be shown in the Y3-axis:
|
X | Choose which information to be shown X-axis:
|
Traces can be synchronized by X-axis offset with different options. Trace synchronization is available when there are two or more trace results selected.
Sync Options | Description |
|---|---|
None | No offset is set to any trace |
Manual | (Only available when there are two trace results selected) |
Peak | Synchronizes the traces by their absolute peak values. |
Set Value | Synchronizes the traces by a specific value:
|
Measurement Point | Synchronizes the traces by a specific measurement point:
|
Buttons | Description |
|---|---|
Remove all Δ | Remove all the deltas. |
Export... | Exports the trace chart view to the following targets:
|
Remove all | This button clears the trace plot area. |
Shunt Calibration
Click the shunt calibration icon
 on a result to get the shunt calibration parameters.
Before a tightening each tool performs a shunt calibration and zero offset compensation.
|
|
|---|---|
Multistep name | Name of the tightening program the tool runs. |
Gain | Relative to measured zero torque. |
Gain Difference | Gain difference compared to previous calibration. |
Gain Limit High | High limit relative to measured zero torque. |
Gain Limit Low | Low limit relative to measured zero torque. |
Gain Max Change | Maximum amount the gain may change compared to previous calibration. |
Offset | Signed offset relative to ideal zero torque. |
Offset Difference | Offset difference compared to previous calibration. |
Offset Limit High | High limit relative to ideal zero torque. |
Offset Limit Low | Low limit relative to ideal zero torque. |
Offset Limit Low | Low limit to ideal zero torque. |
Offset Max Change | Maximum amount the offset may change compared to previous calibration. |
Shunt Failed | True or False. |
Zero Offset Failed | True or False. |
Pinned - Holding area for investigation
Tightening results can temporarily be stored into the Pinned area. This is useful for detailed analysis of a tightening, and prevents the tightening result to be dropped from the window as new results are received.
Manually: On a result, select the Pin icon.

The tightening result is copied to the Pinned area for investigations. It is possible to pin several results to the temporary storage.
Automated: Select the Auto pin drop-down menu and enter number of results to be pinned. Select Start. The next incoming result will be pinned automatically, continuing until the entered number has been reached, or until pressing Stop.
Remove all results from the pinned area
To remove individual results, unpin it by selecting the Pin icon .
Live Results
A controller sends tightening results to ToolsTalk 2 as soon as the task is completed, and the result is added to the top of the Live results. A limited number of results can be stored. When the list is full, the oldest result is dropped from the list.
On the top level the result for a synchronized tightening with several channels contain the following information:
GUI part | Description |
|---|---|
Red bar | The leftmost position in the Live results table may be a red bar icon |
Holding pin | Select the holding pin icon to pin the result to the pinned tab. |
Save icon | This command creates a .csv file with the result data. A dialog window is opened as to save the file in a desired location. |
Trace icon | Select the trace icon to view a graphical view of the results in the Trace workspace. |
Overall Status | OK or NOK. NOK is always in combination with the red bar icon, to quickly identify erroneous tightenings. |
Virtual station name | Name of the virtual station. |
Sync Mode Index and name | Index and name of the sync mode used in the tightening. |
Time Stamp | Time stamp for the tightening, that is, time and date. |
 , indicating erroneous tightenings for quick identification of errors. This corresponds to NOK.


