SPC results, limits and rules
Below are the possible results that summarize the SPC test:
Icon | Tool application | Diagnosis | Further action |
| Can be used | The tool works correctly. | None |
| Can be used | The average is higher than the upper control limit, but it does not exceed the upper tolerance limit. | Calibrate: decrease the torque |
| Can be used | The average is lower than the lower control limit, but it does not fall under the lower tolerance limit. | Calibrate: increase the torque |
| Can be used | Excessive dispersion of the values prevents proper calibration of the tool, but the measured values are still within the tolerance limits. | Repair |
| CANNOT be used | At least one value is higher than the tolerance limit. | Remove the tool from the production line and calibrate: decrease the torque |
| CANNOT be used | At least one value is lower than the tolerance limit. | Remove the tool from the production line and calibrate: increase the torque |
| CANNOT be used | Some measured values are out of tolerance limits. Excessive dispersion of the values PREVENTS proper calibration of the tool. | Remove the tool from the production line and repair |


The SPC Rules give the results listed in the above table.
Below are the SPC test limits:
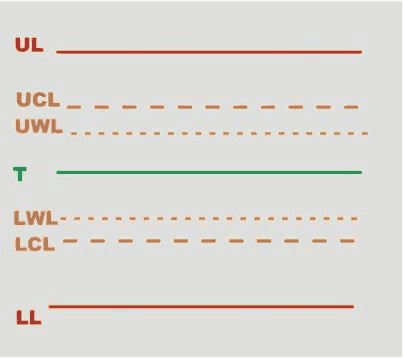
UL | Upper Limit | LWL | Lower Warning Limit |
UCL | Upper Control Limit | LCL | Lower Control Limit |
UWL | Upper Warning Limit | LL | Lower Limit |
T | Target (nominal) |
Upper Limit (UL) and Lower Limit (LL) are the SPC test limits.
The SPC test limits are calculated as follows:
Upper Control Limit (UCL) = ((UL + LL) / 2) + (A · ((UL - LL) / 6))
Lower Control Limit (LCL) = ((UL + LL) / 2) - (A · ((UL - LL) / 6))
Upper Warning Limit (UWL) = ((UL + LL) / 2) + (2/3 · (UCL - ((UL + LL) / 2)))
Lower Warning Limit (LWL) = ((UL + LL) / 2) - (2/3 · (((UL + LL) / 2) - LCL))
Range = D2 · ((UL - LL) / 6)
A and D2 are coefficients that depend on the number of the SPC tests:
Number of SPC tests | A | D2 |
|---|---|---|
1 | 0.000 | 0.000 |
2 | 2.121 | 3.686 |
3 | 1.732 | 4.358 |
4 | 1.500 | 4.698 |
5 | 1.342 | 4.918 |
6 | 1.225 | 5.078 |
7 | 1.134 | 5.204 |
8 | 1.061 | 5.306 |
9 | 1.000 | 5.393 |
10 | 0.949 | 5.469 |
11 | 0.905 | 5.535 |
12 | 0.866 | 5.594 |
13 | 0.832 | 5.647 |
14 | 0.802 | 5.696 |
15 | 0.775 | 5.741 |
16 | 0.750 | 5.782 |
17 | 0.728 | 5.820 |
18 | 0.707 | 5.856 |
19 | 0.688 | 5.891 |
20 | 0.671 | 5.921 |
21 | 0.655 | 5.951 |
22 | 0.640 | 5.979 |
23 | 0.626 | 6.006 |
24 | 0.612 | 6.031 |
25 | 0.600 | 6.056 |
Below are the rules applied to the last set of number of samples performed during a SPC test:
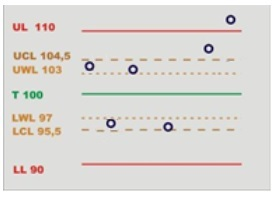
RULE 1 – The last average is outside the control limits
 |
|  |
|
RULE 6 – The dispersion is too large
 |
|  |
| |
Dispersion is too big if it is greater than the range.
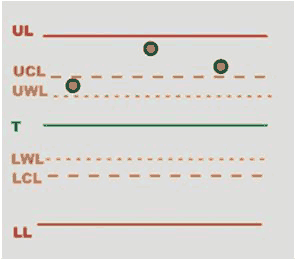
RULE 7 – At least one value outside the tolerance limits
 |
| 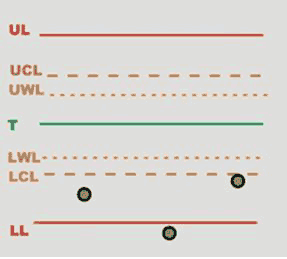 |
|
RULE 8 - The dispersion is larger than the warning limit
 |
|  |
| |
Below are the rules applied to the last averages related to the set of number of samples performed during a SPC test.
The device stores the last seven averages to analyze the trend according to the following rules:
RULE 3 – The last 7 averages are over or under the nominal value
 |
| 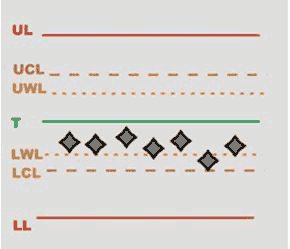 |
|
RULE 4 - The last 7 averages are increasing or decreasing
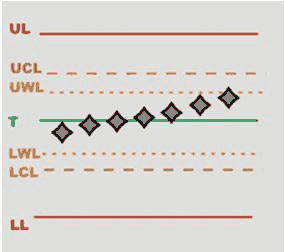 |
|  |
|
RULE 5 - The last 2 averages are outside the warning limits
 |
|  |
|
RULE 2 - The last 4 averages are outside 1/3 of the control limits
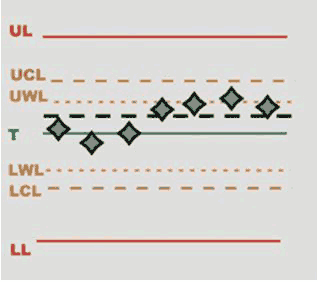 |
|  |
|


