Calculating Statistics
Select a controller in the Plant Structure workspace
 and then select Statistics
 in the menu bar.
In the Configuration section, enter the parameters to collect results stored in the controller (Number of Subgroups, Subgroup Size, and Frequency).
In the Variable Configuration section, double click the variable configuration you want to calculate.
In the variable configuration page, select Calculate at the upper-right corner.
When a statistical calculation is done, the result is sent to the Web HMI and to ToolsTalk 2.
If Calculate is disabled, make sure that:
the controller is online.
SPC configuration is in sync with controller.
the user is authorized to update the controller.
It is not possible to calculate statistics for results from deleted tightening programs or Virtual Stations, unless the results are still stored on the controller.
Statistics Formulas
Data in a subgroup is calculated as:
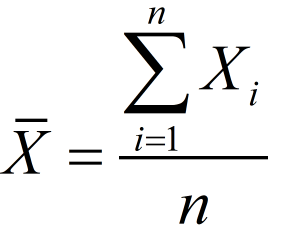
Average:
Range = R = max (Xi) - min (Xi), where i=1...n
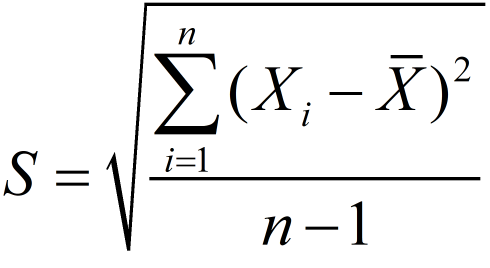
Standard deviation for a subgroup:
Total overall of the standard deviation:
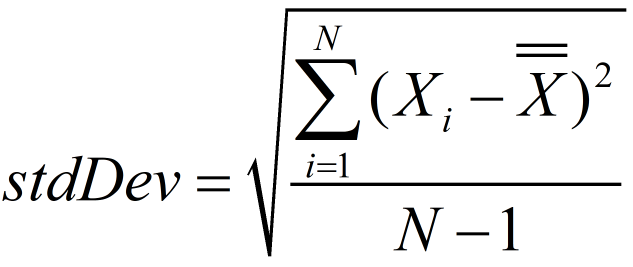
Where N = total number of observations.
When specified number of subgroups to use for calculations has been collected, the SPC function starts calculations to determine the statistical stability.
Calculations are performed through the following steps: (m = number of subgroups)
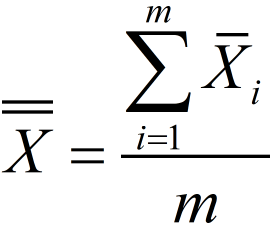
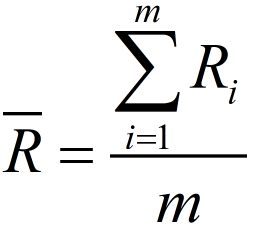
Calculation of Average of Average values:
Calculation of Average of Range:
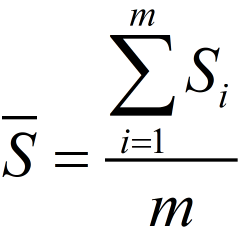
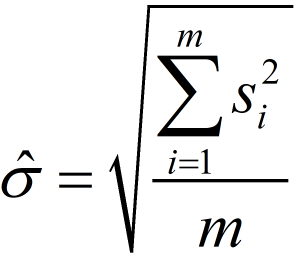
Calculation of Average of Standard deviation:
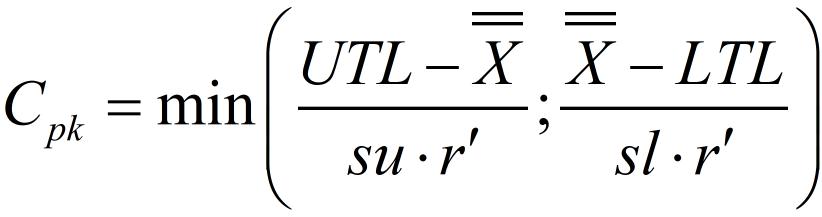
Calculation of the process capabilities Cp and Cpk with respect to Sigma:
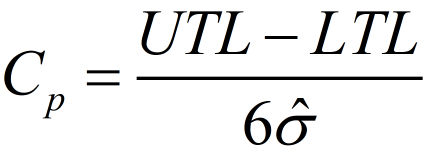
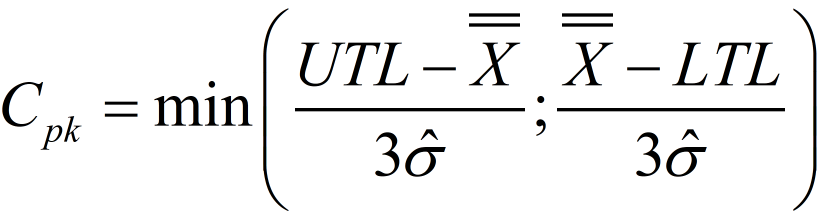
Where:
 is the overall arithmetic average of the observed characteristic values.
UTL is the Upper Tolerance Limit.
LTL is the Lower Tolerance Limit.
The sigma estimation is the mean square standard deviation within the subgroups:
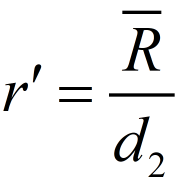
Calculation of the process capabilities Cp and Cpk with respect to Range:
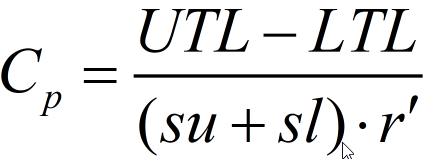
Where for a normal distribution su = sl = 3.
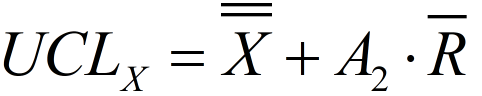
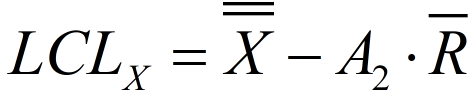
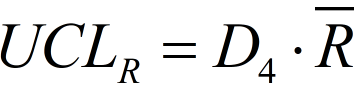
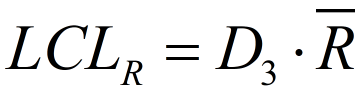
Calculations for control limits if, in the SPC Configuration section, the Auto calculate switch is set to Yes:
X-bar R (Mean)
X-bar R (Range)
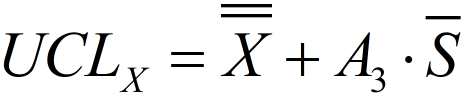
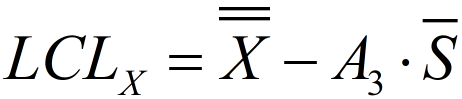
X-bar S (Mean)
X-bar S (Sigma)
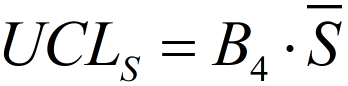
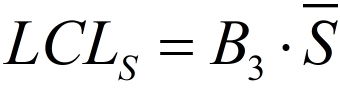
A2, A3, D3, D4, B3, and B4 are constants (for more information, see the "SPC Calculation Constants" paragraph).
SPC Calculations Constants
Subgroup Size | Divisors for estimate of standard dev. | Factors for Control Limits | |||||
|---|---|---|---|---|---|---|---|
Xbar R | Xbar S | ||||||
A2 | D3 | D4 | A3 | B3 | B4 | ||
n | d2 | ||||||
2 | 1.128 | 1.880 | - | 3.267 | 2.659 | - | 3.267 |
3 | 1.693 | 1.023 | - | 2.574 | 1.954 | - | 2.568 |
4 | 2.059 | 0.729 | - | 2.282 | 1.628 | - | 2.266 |
5 | 2.326 | 0.577 | - | 2.114 | 1.427 | - | 2.089 |
6 | 2.534 | 0.483 | - | 2.004 | 1.287 | 0.030 | 1.970 |
7 | 2.704 | 0.419 | 0.076 | 1.924 | 1.182 | 0.118 | 1.882 |
8 | 2.847 | 0.373 | 0.136 | 1.864 | 1.099 | 0.185 | 1.815 |
9 | 2.970 | 0.337 | 0.184 | 1.816 | 1.032 | 0.239 | 1.761 |
10 | 3.078 | 0.308 | 0.223 | 1.777 | 0.975 | 0.284 | 1.716 |
11 | 3.173 | 0.285 | 0.256 | 1.744 | 0.927 | 0.321 | 1.679 |
12 | 3.258 | 0.266 | 0.283 | 1.717 | 0.886 | 0.354 | 1.646 |
13 | 3.336 | 0.249 | 0.307 | 1.693 | 0.850 | 0.382 | 1.618 |
14 | 3.407 | 0.235 | 0.328 | 1.672 | 0.817 | 0.406 | 1.594 |
15 | 3.472 | 0.223 | 0.347 | 1.653 | 0.789 | 0.428 | 1.572 |
16 | 3.532 | 0.212 | 0.363 | 1.637 | 0.763 | 0.448 | 1.552 |
17 | 3.588 | 0.203 | 0.378 | 1.622 | 0.739 | 0.466 | 1.534 |
18 | 3.640 | 0.194 | 0.391 | 1.608 | 0.718 | 0.482 | 1.518 |
19 | 3.689 | 0.187 | 0.403 | 1.597 | 0.698 | 0.497 | 1.503 |
20 | 3.735 | 0.180 | 0.415 | 1.585 | 0.680 | 0.510 | 1.490 |
21 | 3.778 | 0.173 | 0.425 | 1.575 | 0.663 | 0.523 | 1.477 |
22 | 3.819 | 0.167 | 0.434 | 1.566 | 0.647 | 0.534 | 1.466 |
23 | 3.858 | 0.162 | 0.443 | 1.557 | 0.633 | 0.545 | 1.455 |
24 | 3.895 | 0.157 | 0.451 | 1.548 | 0.619 | 0.555 | 1.445 |
25 | 3.931 | 0.153 | 0.459 | 1.541 | 0.606 | 0.565 | 1.435 |


