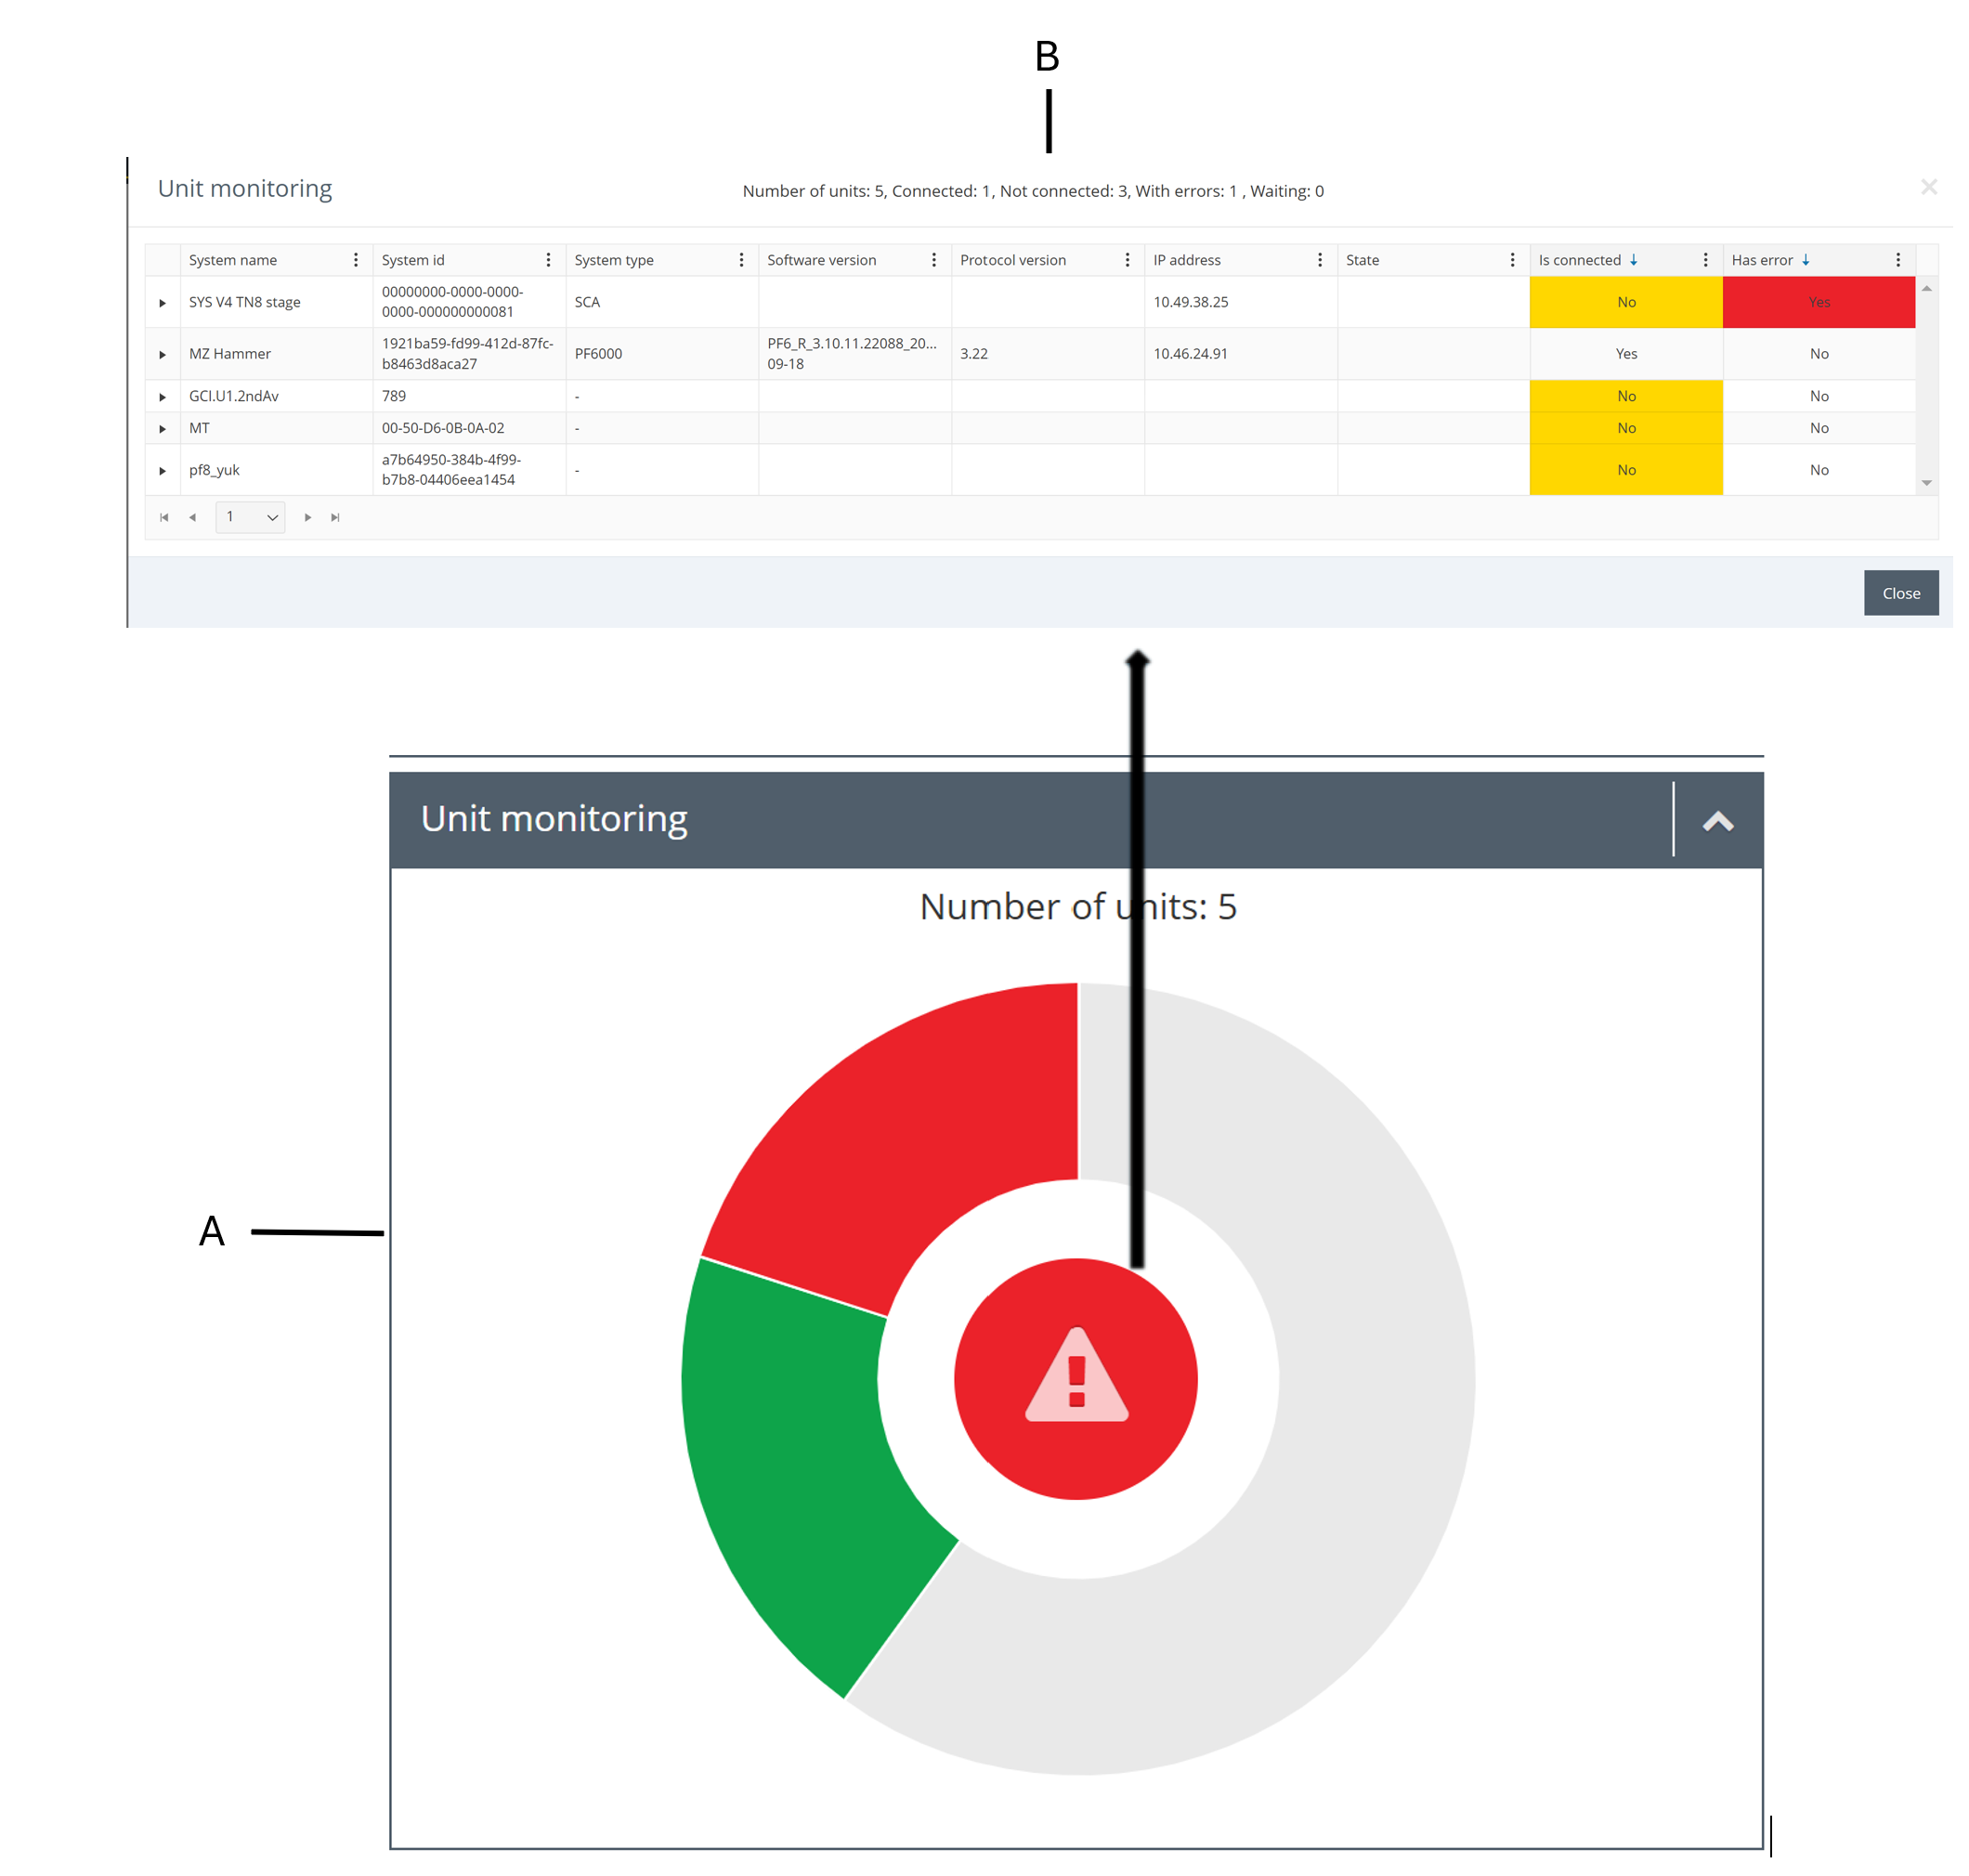
Unit Monitoring Widget
Unit Monitoring Widget displays the current distribution of connected, waiting and not connected controllers and those with errors. If controller has a faulty message for less than 10 minutes in the controller queue, then controller will counted as waiting. If any controller has a faulty message for more than 10 minutes in the controller queue, a red symbol is shown in the center of the doughnut chart. When selecting the center of the doughnut chart, a detailed table of the controllers is displayed. The detailed table shows information about the reporting controllers and their current status (Is connected and/or Waiting and/or Has error). It is possible to expand a row for more details. If a controller has multiple errors, only the latest error is shown in the detailed table.

A | Doughnut chart |
B | Detailed table |


