Program Scatter Tab
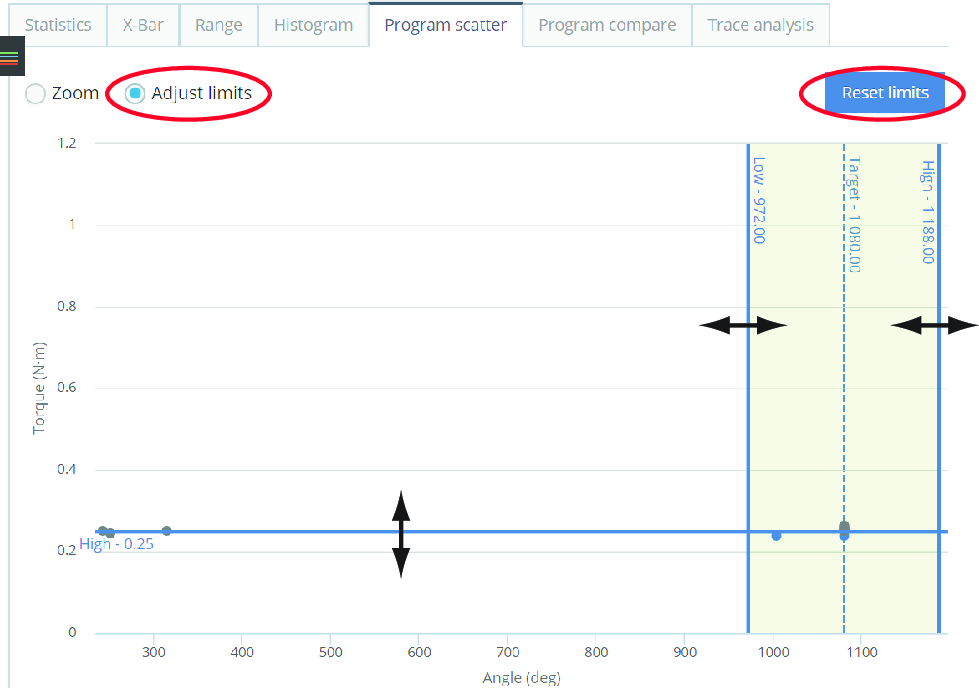
The Program scatter tab displays a scatter diagram with the accuracy of the results in violation to the limits. It is also possible to identify and follow up outlines. It is possible to adjust the limit lines to change OKs into NOKs, or NOKs into OKs. The adjustments made are displayed in two tables. These are useful when fine-tuning the limits.

General | Changed status |
|---|---|
Total | OK to NOK count |
OK Count | OK to NOK % |
NOK Count | NOK to OK count |
NOK % | NOK to OK % |
Select to select the Adjust limits radio button.
Select and hold to drag the limit lines one at the time.
Select the Reset limits button to reset to the initial limits.

Select Zoom.
Select and hold the left mouse button to drag a rectangle around the area to zoom in on (repeat to zoom more).
To pan the zoom area in any direction, select and hold the Shift key and drag.
Select Reset zoom to return to the standard view.


