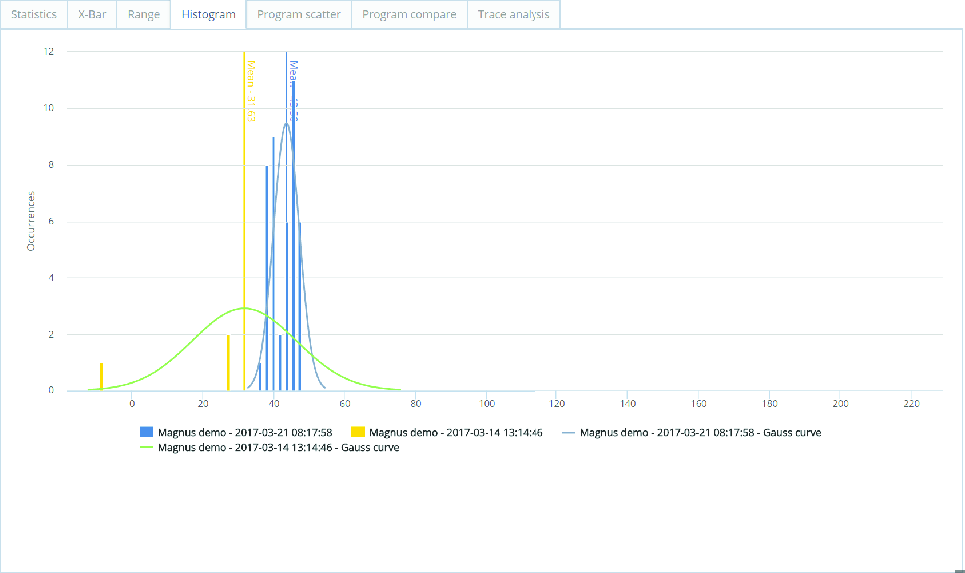
Histogram Tab
The Histogram tab displays the probability distribution of the data set. The graph will also display a Gauss curve with the normal distribution for the corresponding data.
If two programs are selected, both will be shown for comparison.


