Trace Analysis Tab
The Trace analysis tab displays statistics based on the selected traces. It is possible to compare two programs, as long as they are of the same system type.
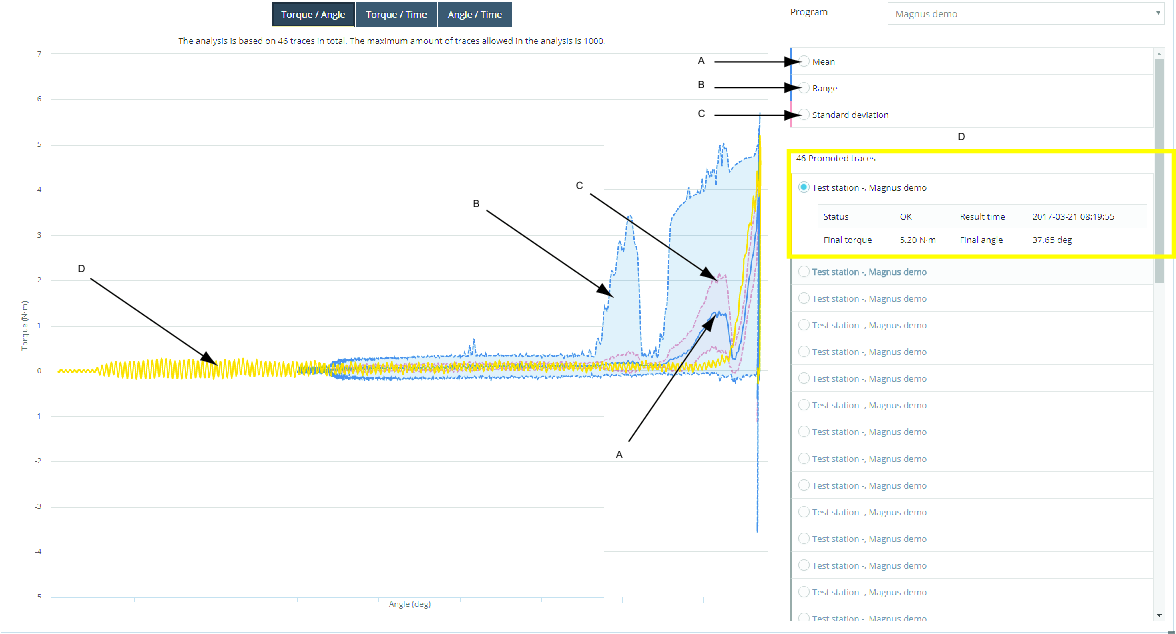
A | Mean | C | Standard deviation |
B | Range | D | Result trace |
The maximum amount of traces allowed in the analysis is 1000.
Select trace axis value
It is possible to change values on the trace axis X and Y.
Torque/Angle
Torque/Time
Angle/Time
Selecting a program
In the Program drop down list, select the program to analyze.
Selecting a statistics curve
Select one or more of the statistics curve names to display, or hide the curve.
Mean (A).
Range (B).
Standard deviation (C).
Selecting traces
Select one or more of the result trace (D) names to display the trace.
Select one of the result trace options to display information about the trace.
Relevant Information


