Stored Results
The controller stores the result for every tightening or loosening performed.
Showing Stored Results
On the Home view, select the Reports Tab. On the left side, Results is automatically selected.
In the Results window, select View all results.
The results list shows with the following information:Date: date and time of the tightening performed.
Virtual Station: Virtual Station which the tightening was performed with.
Tightening Program: Tightening Program column shows Multistep Tightening Program name, or Batch Sequence name followed by the Tightening Program name within the Batch Sequence.
Result: Torque / Angle result.
Limits: Limits column shows values only when the user sets Step Monitor or Step Restriction, or Program Monitor or Program Restrictions.
Step Monitors, Step Restrictions, Program Monitors and Program Restrictions are applicable for Final Torque and Final Angle.
Details: Tightening / loosening result details.
Trace checkbox: By selecting a trace checkbox the corresponding result will be shown in the Sync trace result view.
In the Limits column, the minimum / maximum value can be red colored.
In this case, the red colored value means that any of the following has occurred:
The measured value is lower than the minimum value set in the Multistep Program.
The measured value is higher than the maximum value set in the Tightening Program.
Showing and Reading Result Traces
On the Home view, select the Reports Tab. On the left side, Results is automatically selected.
In the Results window, select View all results.
The results list shows in the Results window.Select the necessary result.
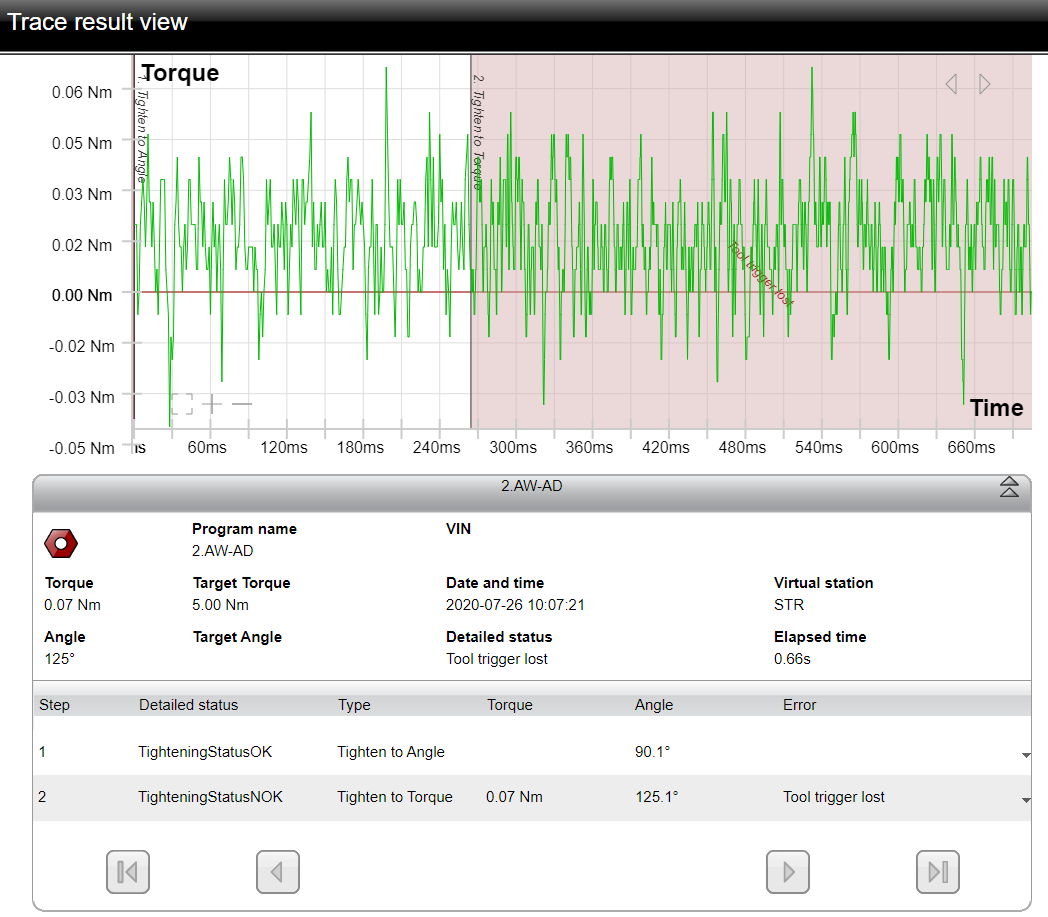
The tightening trace shows in the Trace Result View window.
Trace Result View window shows, step by step, the tightening life-cycle.
When the tightening is NOK, Trace Result View window shows which Step Monitor or Step Restriction caused it.
On the trace graph, the Step Monitor or Step Restriction that caused the NOK tightening in the Step level, is red colored.
On the upper-right corner of the trace graph, select the left-arrow / right-arrow to show the necessary trace graph.
The following trace graphs are available:
Torque / Time
Torque / Angle
Angle / Time
Speed / Time
Speed / Angle
Gradient / Time (when the tightening program is configured to make a gradient trace)
Gradient / Angle (when the tightening program is configured to make a gradient trace)
Current / Time
Current / Angle
Step lines are upon the trace graph.
On the trace graph, it is possible to zoom in/out, move the trace, and read x-axis and y-axis values on a specific point.
On the lower-left corner of the trace graph, select "+" to zoom in , "-" to zoom out, or the "square icon" to reset the zoom level back to the default view.
On the lower part of the Trace Result View window, select the necessary step to open a pop up window with the detailed step information.


