存储的结果
The controller stores the result for every tightening or loosening performed.Power Focus XCPower Focus XC can store up to 10,000 results.
显示存储的结果
在主视图上,选择报告选项卡。 Results is automatically selected on the left pane.
在结果窗口中,选择查看所有结果。
结果列表显示以下信息:日期:执行拧紧的日期和时间。
虚拟站点:执行拧紧所用的虚拟站点。
拧紧程序:“拧紧程序”列显示“多步骤拧紧程序”名称或“批处序列”名称,后跟“批处序列”中的“拧紧程序”名称。
结果:扭矩/角度结果。
限值:“限值”列仅在用户设置“步骤监视器”或“步骤限制”或“程序监视器”或“程序限制”时显示数值。
步骤监视器、步骤限制、程序监视器和程序限制适用于最终扭矩和最终角度。
详情:拧紧/拧松结果详情。
轨迹复选框:通过选中绘制图复选框,相应结果将显示在同步绘制图结果视图中。
在限值列中,最小值/最大值可能是红色的。
在这种情况下,红色值表示发生了以下任何情况:
测量值低于在多步骤程序中设置的最小值。
测量值高于在拧紧程序中设置的最大值。
显示和读取结果绘制图
在主视图上,选择报告选项卡。 Results is automatically selected on the left pane.
在结果窗口中,选择查看所有结果。
结果列表显示在结果窗口中。选择必要的结果。
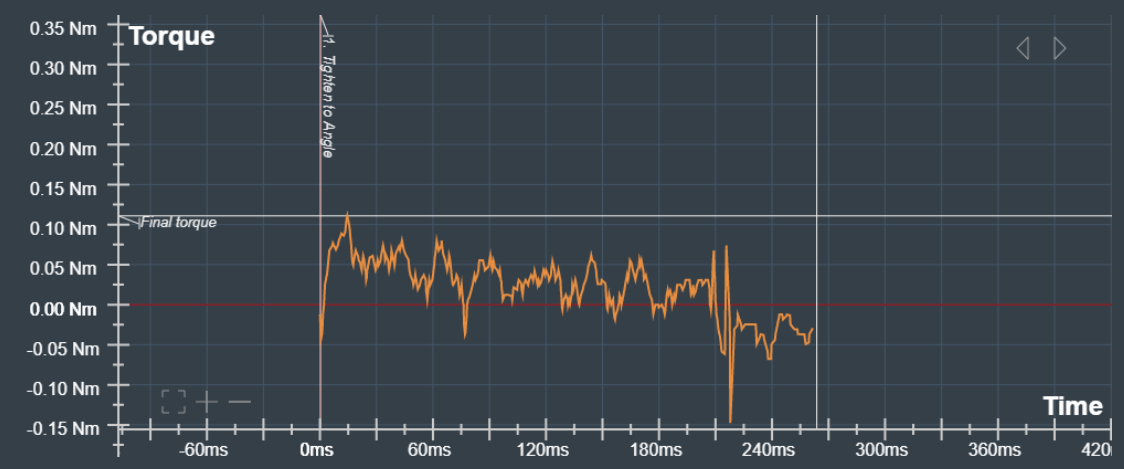
拧紧绘制图显示在绘制图结果视图窗口中。
绘制图结果视图窗口将逐步显示拧紧寿命周期。
当拧紧为 NOK 时,绘制图结果视图将显示引发它的步骤监视器或步骤限制。
在绘制图图形上,导致步骤级别的 NOK 拧紧的步骤监视器或步骤限制显示为红色。
1 | Result view Trace Graph |
2 | 结果视图 - 数字 |
3 | Result view Step Monitors |
4 | 结果视图 - 跟踪 |
结果视图 - 跟踪
This section shows the tightening in the shape of a graph.

Use the arrows in the upper-right corner of the trace graph to view the different trace graphs available for the tightening result selected.
下列轨迹图可用:
扭矩/时间
扭矩/角度
角度/时间
速度/时间
速度/角度
变化率/时间(将拧紧程序配置为进行变化率跟踪时)
变化率/角度(将拧紧程序配置为进行变化率跟踪时)
电流/时间
电流/角度
步骤线位于绘制图图形上。
在轨迹图上,可以放大/缩小、移动轨迹以及读取特定点的 x 轴和 y 轴值。
在轨迹图的左下角,可选择“+”放大、选择“-”缩小,或选择“正方形图标”将缩放级别重置回默认视图。
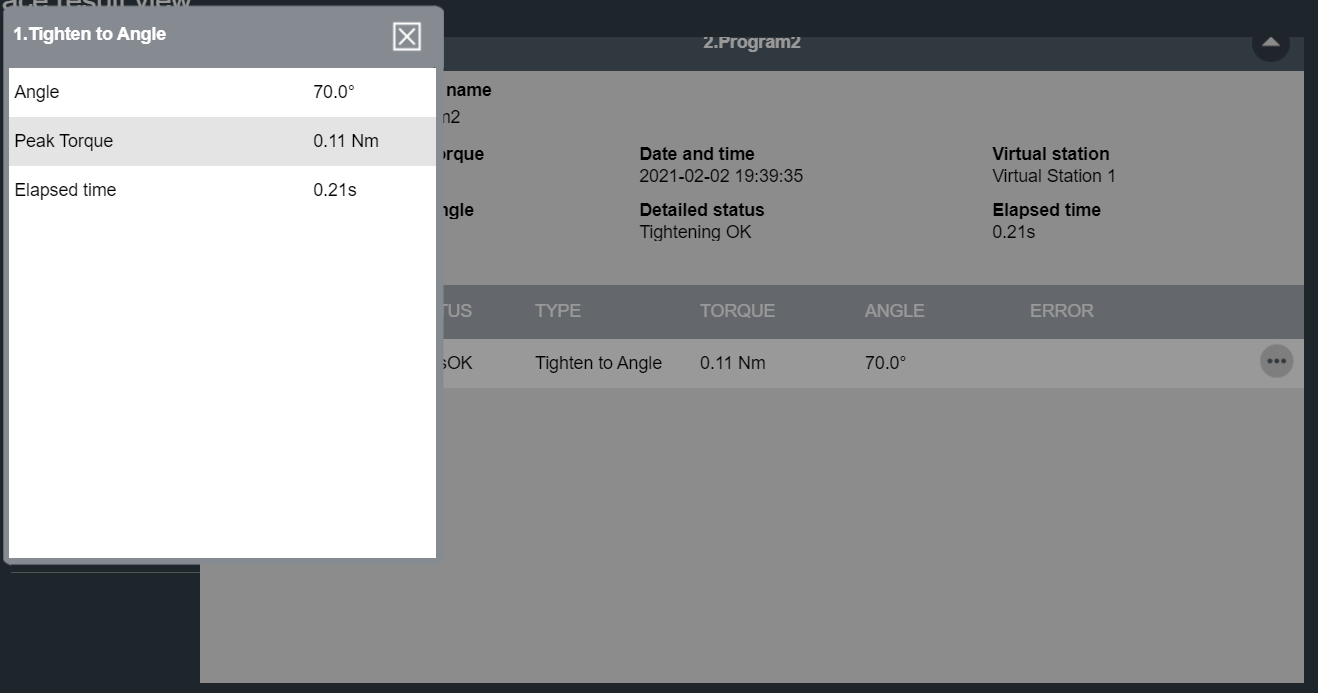
结果视图 - 数字
This section displays the result in numbers. There is also information about the tightening program, the virtual station, the date and time of the tightening, the status, etc. .This view will also display some identifiers like the VIN.

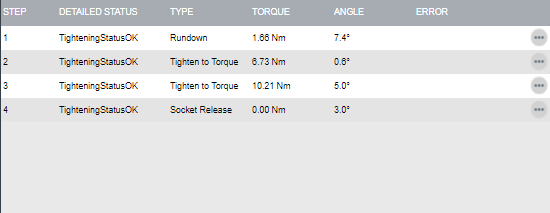
Result View - Step Monitors
This section shows a list of the tightening results with information about the step monitors used and other step information.

Select the ellipsis icon on the different tightening results listed to get further information.

结果视图 - 结果报告器
列表显示了来自结果报告器的值。如果为程序监视器/限制定义了结果报告器,则报告该监视器/限制中的值。如果没有为程序监视器/限制定义结果报告器,则将报告来自主路径中最新执行的结果报告器的值。

如果在程序中定义了多个相同类型的报告者,则评估顺序为:
程序监视器/程序限制结果报告。
主路径中最后执行步骤的监视器/限制结果报告。
相应结果报告器设置的最高级别多步结果的值:
结果报告器最终角度设置的最终角度
结果报告器最终扭矩设置的最终扭矩
结果报告器当前设置的当前


