Live Results
On the home view, select the Go Result button to see the live results.
The Live Results pop up window shows results from the different virtual stations on the controller in the upper four as well as the lower four panes. The reason for this is that you can choose two different result views for the same virtual station to be shown at the same time.
Select a result pane to open a window where you can step through the four different result views by clicking the arrows at the sides of the result window.
Result View: Numbers
The first window will display the result in numbers.
1 | Virtual station name |
2 | NOK tightening error message |
3 | Tightening torque result |
4 | Target torque |
5 | Tightening program name |
6 | Result status
|
7 | Controlling Type: Torque or Angle |
8 | Go to extended results view |
9 | Close window |
10 | Tightening angle result |
11 | Target angle |
12 | Batch sequence name |
13 | Angle compensation result |
Result View: Extensive Result
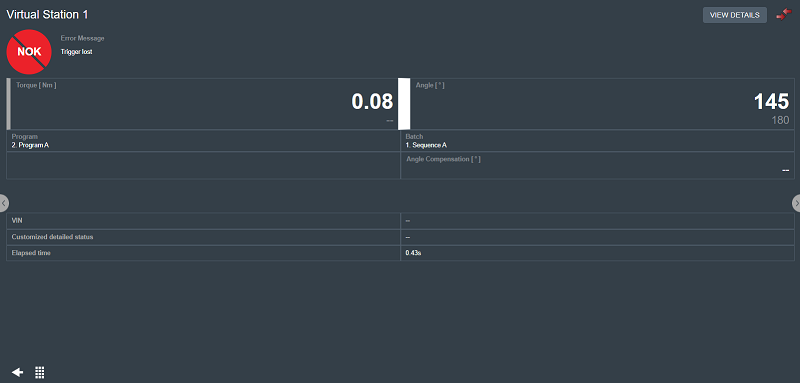
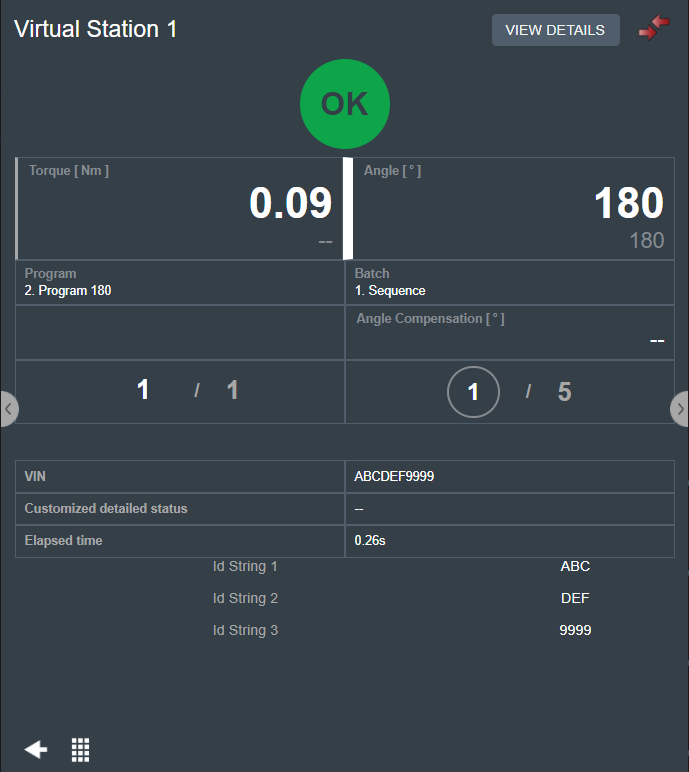
Select the square icon (□) in the upper-right corner of the result window to get an extended view of the results. This view will display some identifiers like the VIN and some additional information such as the customized detailed status or the elapsed time.
If the result is NOK, an explanatory message appears.
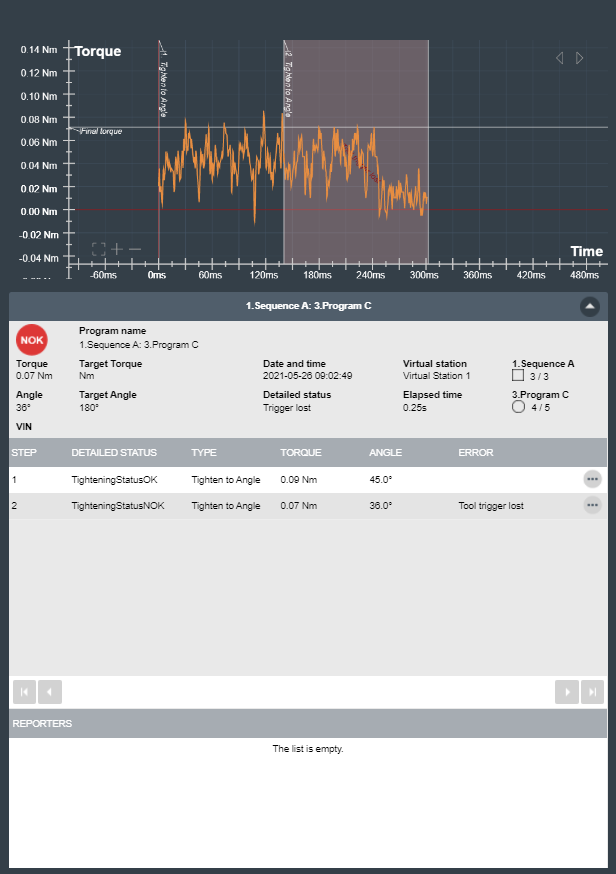
Tap the View Details button in the upper-right corner of the screen to see the trace result view of the live result.
Result View - Result Reporters
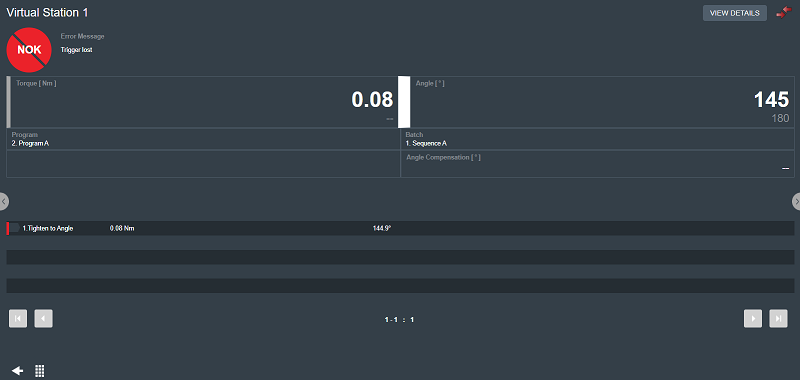
The list shows the values from the result reporters.
If there is a result reporter defined for a program monitor or restriction, the value from that monitor or restriction is reported. If there is no result reporter defined for a program monitor or restriction, the value from the latest executed result reporter is reported.
Evaluation order if several reporters of the same type are defined in a program:
Result reporter on program monitor or program restriction.
Result reporter on monitor or restriction of the last executed step in main path.
Values on the highest level of the multistep result set by the corresponding result reporter:
Final angle set by result reporter final angle
Final torque set by result reporter final torque
Current set by result reporter current
The step result originating the NOK result shows a red bar.
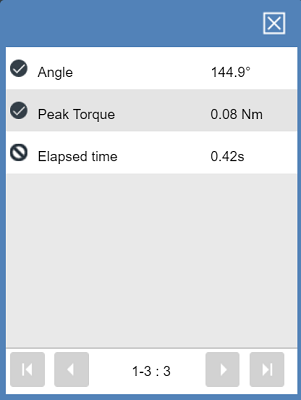
Select the different result reporters listed to get further information.
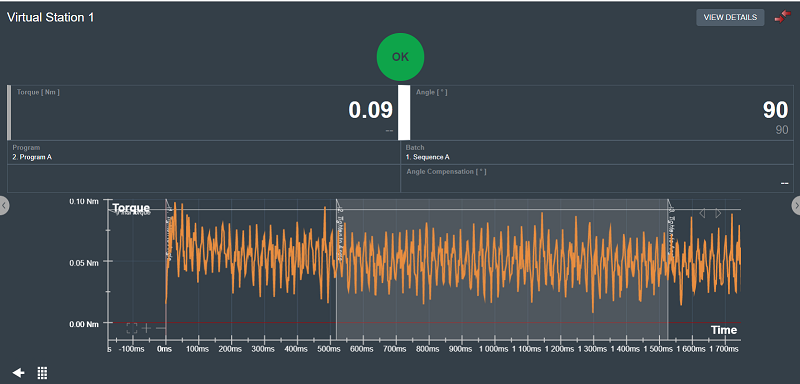
Result View: Trace Graph
With the trace result view, one can learn better how the tightening behaves, in order to make adjustments to the tightening program. Depending on the tightening strategy, the trace will display different tightening parameters. Use the arrows in the upper-right corner of the trace graph to view the different trace graphs available for the tightening result selected.
The following trace graphs are available:
Torque / Time
Torque / Angle
Angle / Time
Speed / Time
Speed / Angle
Gradient / Time (when the tightening program is configured to make a gradient trace)
Gradient / Angle (when the tightening program is configured to make a gradient trace)
Current / Time
Current / Angle
On the trace graph, it is possible to zoom in/out, move the trace, and read x-axis and y-axis values on a specific point.
On the lower-left corner of the trace graph, select the plus icon (+) to zoom in , the minus icon (-) to zoom out, or the square icon (□) to reset the zoom level back to the default view.
Result View - High-Low Result
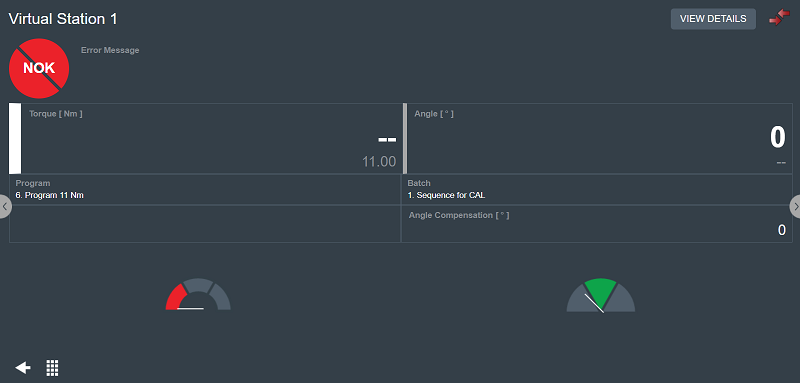
This result view shows whether the result is high, low or within the set limits.
The graphic display shows if the tightening result is too high or too low with respect to the given limits for the tightening program.
The graphic on the left shows the torque values. The graphic on the right shows the angle values.
If the result is OK, the graphic is green, if the result is NOK, the graphic is red.
Result View - Identifier Strings
This result view shows the identifier strings included in a multiple barcode scan.
Result View: Batch Sequence Results
This result view shows information about the status of the different batches in a batch sequence (Batch/Overview) and information about the tightenings in every batch (Count/Overview). The results shown apply to the selected batch sequence.
If the result is NOK, an explanatory message appears.
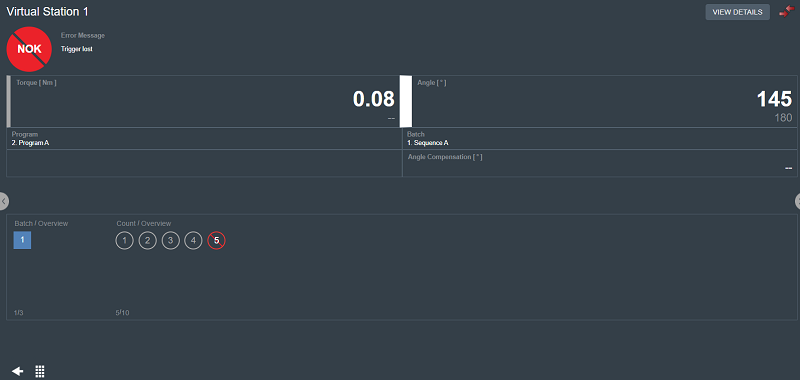
The squares symbolize each batch in a batch sequence. The currently selected batch has a blue background. A batch that contains a NOK tightening has red borders and a diagonal red line.
The circles symbolize each tightening in every batch. NOK tightenings have a red border and a red diagonal line.


